

Identifying true price anomalies is the key to profitable trading but the process is complex and has many pitfalls. In this article I provide an example of how to identify thousands of potential price anomalies on a daily basis and test their significance.
The only practical way of identifying potential price anomalies is through data-mining. However, there are several problems with this approach:
- Data-mining bias
- Small samples
- A time-consuming process
A common mistake that some quants make is looking for price anomalies that have a sufficient sample in the history of a specific security. However, this approach is too restrictive because a price anomaly may not offer sufficient samples. In reality, an anomaly can have a very small sample, even of a single occurrence, and be robust across a large group of comparable securities. Therefore, by restricting data-mining results to have large samples, many potentially robust edges are not identified.
Below is an example of how data-mining can be used to identify thousands of potential anomalies in 12 liquid ETFs on a daily basis. The data-mining software used is Price Action Lab. This software does deterministic data-mining, meaning that it generates the same output given the same input and criteria, as opposed to other data-mining methods that are based on neural networks or genetic algorithms that exhibit instabilities due to their inherent random nature.
The process followed involves three steps:
- ETF and data-mining criteria selection
- Identification of price anomalies
- Validation using a portfolio of comparable securities
Step 1: ETF and data-mining criteria selection
The following ETFs were selected after the close of March 16, 2016, with adjusted EOD data since inception: DBC, DIA, EEM, GLD, IWM, QQQ, SLV, SPY, TLT, USO, XLE, XLF. We are looking only for price anomalies that signal a position after the market close on March 16, 2016.
The criteria for the data mining are as follows:
- Long positions only
- At least one trade in the history of each ETF
- 2% profit target and stop-loss
The win rate (% profitable for long), profit factor, number o trades and consecutive losers are set to values that do not affect the data mining bias, 0%, 0, 0 and 100, respectively, . The win rate for short (% profitable for short) is set to greater than 100% to restrict the output to long anomalies, also called price patterns in Price Action Lab. The process can be repeated for short patterns if desired. Below is the workspace used for the data-mining:
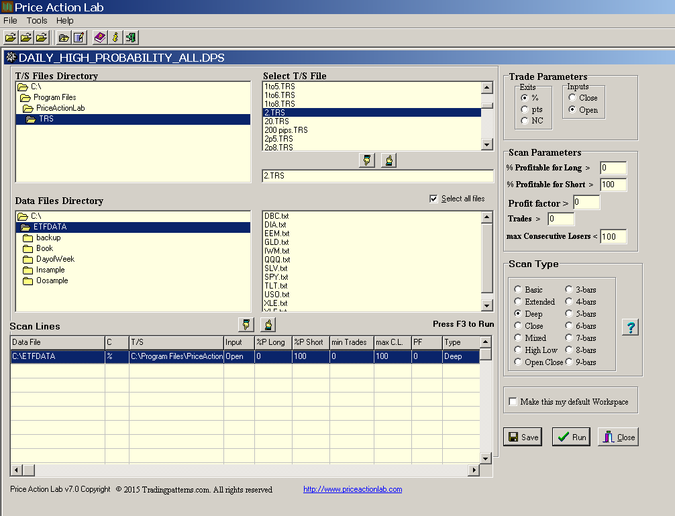
The profit target and stop-loss are set to levels that prevent curve-fitting of the exits and are used only by the data-mining algorithm. In general, these are not the exit levels used in actual trading. Also, a Deep search option was used to provide maximum capability of price pattern detection.
Step 2: Identification of price anomalies
The process is time-consuming and may take about 30 minutes depending on CPU speed. Using several different instances of the program running on different CPU cores decreases the execution time accordingly. The results are shown below:
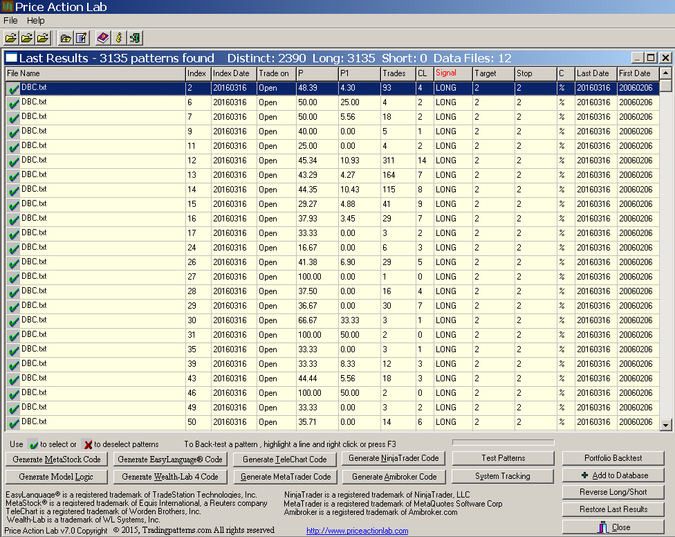
In the result, P is the pattern win rate, P1 is the 1-Bar win rate, Trades is the number of trades, CL is the maximum number of consecutive losers and Target and Stop the values of the profit target and stop-loss. C indicates the type of target and stop-loss.
The program identified 3135 potential price anomalies in the 12 data files. Note that all these price patterns formed as of the close of March 16, 2016. It may be seen that some have a sample size of 1. Below is the output sorted for highest number of trades:
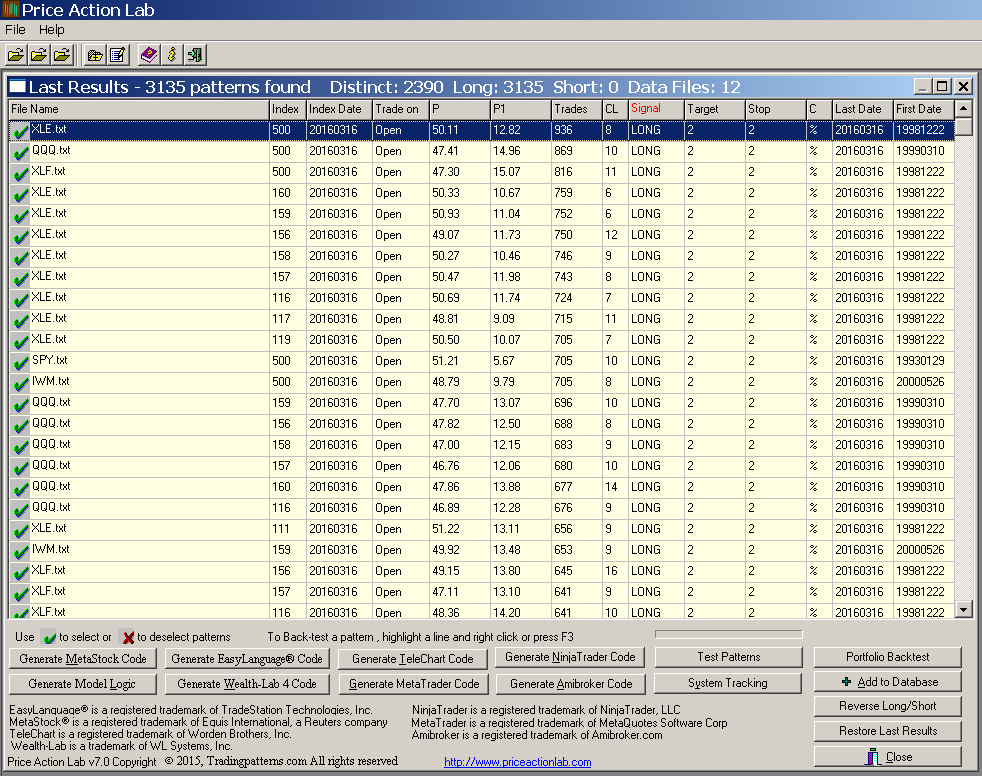
It may be seen from the sorted results that some anomalies have a large trade sample (T) but low win rate (P). More importantly, the overwhelming majority of these patterns are random flukes. We need to validate these anomalies and this is where the real work starts. Both the method of validation and the speed matter. Note that since we are looking for patterns for next day trading there is no out-of-sample. However, even if there was one, these tests are problematic due to data-snooping.
Step 3: Validation using a portfolio of comparable securities
We will validate each of the 3135 potential price anomalies using a portfolio of comparable securities. For this purpose we select the DOW-30 stocks with adjusted EOD data since 01/2000. Portfolio backtests are time consuming and this process may take about one hour with a single CPU. If the task is shared by several processors the execution time decreases accordingly.
A new option was developed for the portfolio backtest of Price Action Lab that allows filtering the results for portfolio win rate, profit factor and number of trades. This is shown in the portfolio backtest options below:
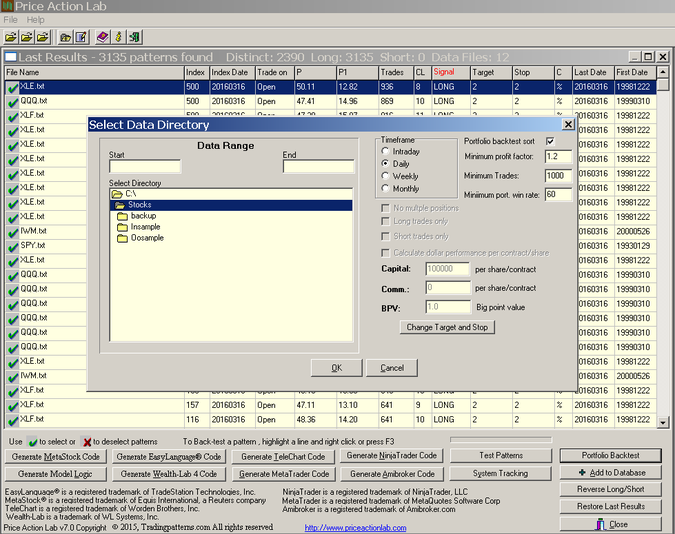
Since it would be virtually impossible to examine all results visually, we ask the program to display only those with portfolio profit factor greater than 1.2, more than 1000 trades and portfolio win rate greater than 60 (number of profitable securities in the portfolio.) The results are shown below:
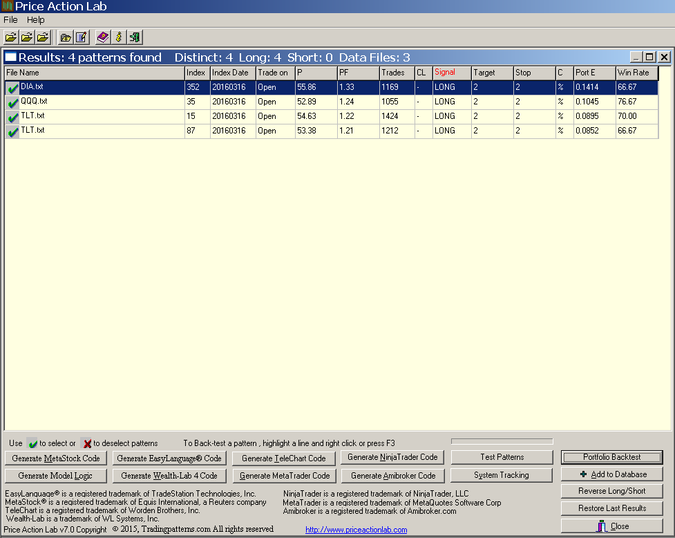
These are hypothetical results. See disclaimer at the end of this article.
P is the pattern win rate in the portfolio, Trades is the number of trades in the portfolio and Target and Stop the values of the profit target and stop-loss. C indicates the type of target and stop-loss (%, points, or next close exit). PF is the portfolio profit factor, PortE is the portfolio expectation and Win Rate is the proportion of securities with positive expectation.
Only four patterns survived the validation test, one for each of DIA and QQQ and two for TLT. These patterns met the validation criteria. The general idea is that if these patterns can perform well in a portfolio of 30 securities, then they may have an edge, i.e., they may correspond to true market anomalies.
Note that for the day that followed, DIA gained 0.8%, QQQ lost 0.05% and TLT rose 0.22%, all from the open, which is the practical trade entry level. It is interesting that DIA and TLT both gained although stocks and bonds are in general anti-correlated.
Summary
Trading profitably is equivalent to being able to identify anomalies in price series. In the past traders attempts to do this by identifying visually chart patterns and patterns of technical indicators. That process was plagued by data-mining bias and in many cases confirmation bias because there was no straightforward way of validating the patterns. This process is still being used by the majority of trades who fail to understand that most patterns are random formations and represent no exploitable edge. Identifying price anomalies the right way requires a proper data-mining procedure and validation. This is a time-consuming process that depends on the use of proper tools but it is essentially what can allow differentiating between noise and potential opportunities. Trades should also be aware that there are no guarantees that any identified price anomaly based on past data will be actually profitable in the future due to changing market conditions and other known and unknown factors.
Subscribe via RSS or Email, or follow us on Twitter.
Data-mining program: Price Action Lab
Disclaimer
CFTC RULE 4.41 – HYPOTHETICAL OR SIMULATED PERFORMANCE RESULTS HAVE CERTAIN LIMITATIONS. UNLIKE AN ACTUAL PERFORMANCE RECORD, SIMULATED RESULTS DO NOT REPRESENT ACTUAL TRADING. ALSO, SINCE THE TRADES HAVE NOT BEEN EXECUTED, THE RESULTS MAY HAVE UNDER-OR-OVER COMPENSATED FOR THE IMPACT, IF ANY, OF CERTAIN MARKET FACTORS, SUCH AS LACK OF LIQUIDITY. SIMULATED TRADING PROGRAMS IN GENERAL ARE ALSO SUBJECT TO THE FACT THAT THEY ARE DESIGNED WITH THE BENEFIT OF HINDSIGHT. NO REPRESENTATION IS BEING MADE THAT ANY ACCOUNT WILL OR IS LIKELY TO ACHIEVE PROFIT OR LOSSES SIMILAR TO THOSE SHOWN.


