

This is an example of discretionary quantitative long/short trading of Dow 30 stocks in daily timeframe with DLPAL DQ price action anomaly scanner.
DLPAL DQ is an end-of-day (EOD) scanner of price action anomalies, also known as parameter-less price patterns. The program identifies anomalies in historical price data that fulfill user-defined performance statistics and risk/reward parameters and are formed as of the last bar in the input data files. DLPAL DQ generates code for strategies for the Quantopian platform, Tradestation (EasyLanguage), Multicharts (EasyLanguage), NinjaTrader 7 and Amibroker AFL. The program also offers two validation methods.
Click here for information of how to request a fully functional two-week trial of the program.
Example of program use after the close of Wednesday, November 8, 2017
Stock group to scan: Dow 30. Data: adjusted from 01/03/200 to 11/08/2017
Scan workspace
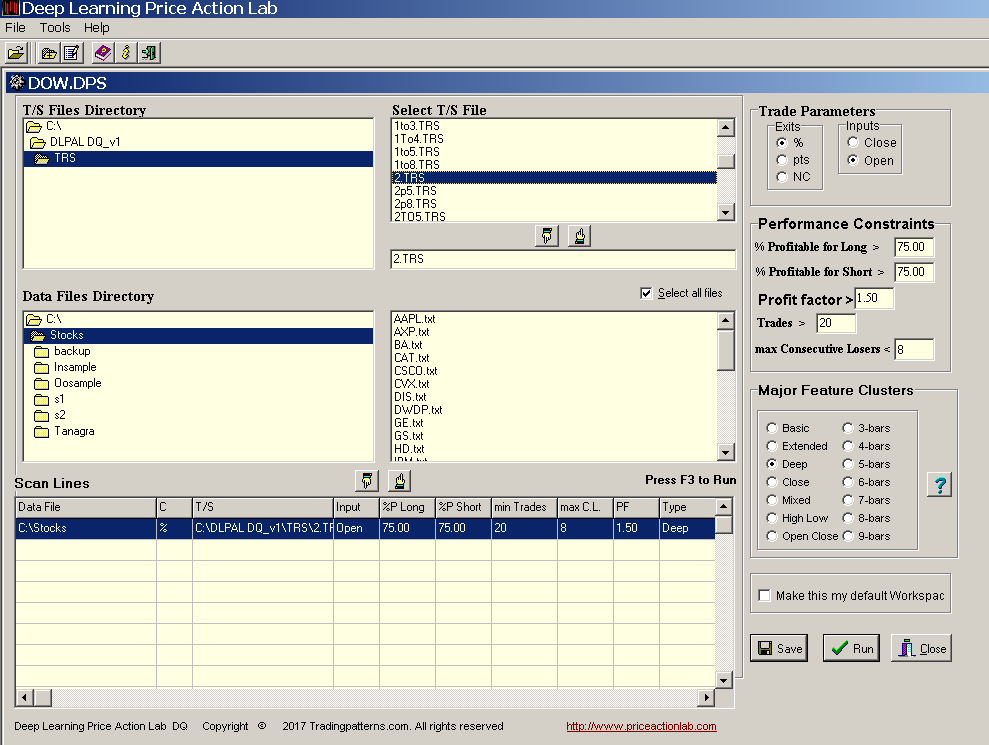
We are looking for high probability anomalies in the Dow 30 stocks with more than 20 trades, win rate higher than 75%, profit factor greater than 1.5 and with less than 8 consecutive losers for 2% profit target and stop-loss.
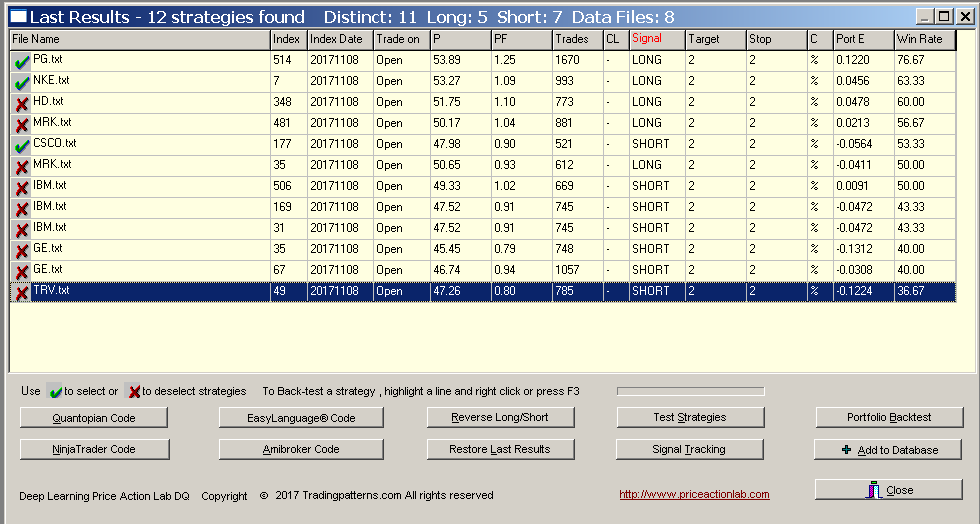
Scan results
The results for the parameters selected are shown below:

Validation
The anomalies found as of the close of Wednesday, November 8, 2017, in Dow 30 stocks in the results above may be random. We need to validate them. For this purpose we use the DLPAL DQ portfolio backtest option and we test each anomaly on all 30 stocks. The results are shown below:
We then select the top two stocks with long anomalies that show a Win Rate of more than 60% for the group, i.e., they are profitable in more than 60% of the stocks and a short anomaly that is profitable in more than 50% of the stocks. These are marked in the results as PG and NKE for longs and CSCO for short.
Robustness tests can be used for additional validation. This is an example for the short anomaly in CSCO:
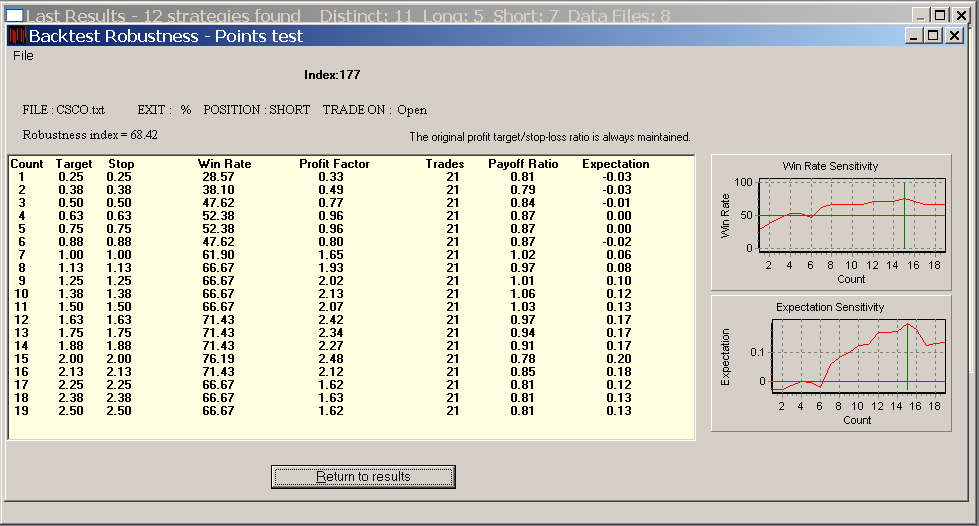
The Robustness Index if 68.42 which is an acceptable level for short anomalies as they are very sensitive to changes in exit levels. The expectation curve is rising and the win rate curve is fairly constant.
Simple backtests can also reveal interesting properties of anomalies. Below is a backtest of the PG anomaly:
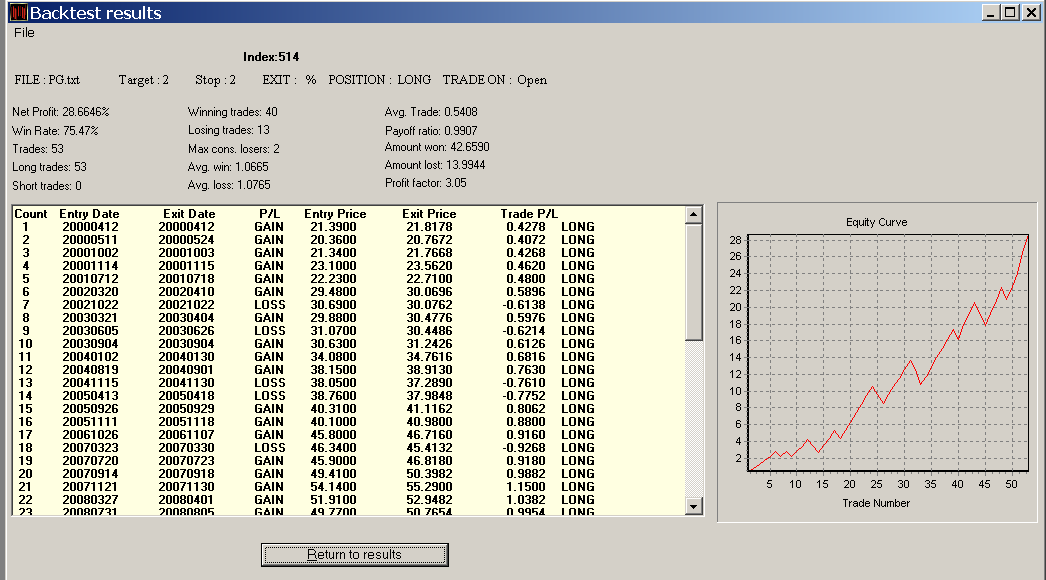
The above anomaly has high profit factor on a relatively large sample size of 53 trades. The larger the trade sample, the higher the power of the test.
Next day performance
Since the price action anomalies are determined after the market close, their performance must be evaluated from the open of the following day. The Dow Jones Industrial Average fell 0.4% on the following day. From the open to the close of the day, a long position for PG gained 0.49% and for NKE a long position gained 1.13%. A short position for CSCO gained 0.7%.
Click here for information of how to request a fully functional two-week trial of the program.
For more articles about all DLPAL versions click here.


