


Last year due to very low volatility in the stock market there were numerous articles and posts in financial blogosphere and social media about “the quietest period in stock market history.” Here I use three volatility metrics to debunk those claims.
The first metric is the number of days that the S&P 500 has spent in a 15% or larger drawdown. This is shown in the chart below:

The most recent count of days the index has spent above a 15% drawdown is 1469 versus 1928 in the 1990s. Therefore, according to this metric, the quietest period was in the 1990s.
Since drawdown profiles ignore daily volatility, one could argue that they are not a good metric of “quietness”. Below is a second metric based on the 252-day annualized volatility.
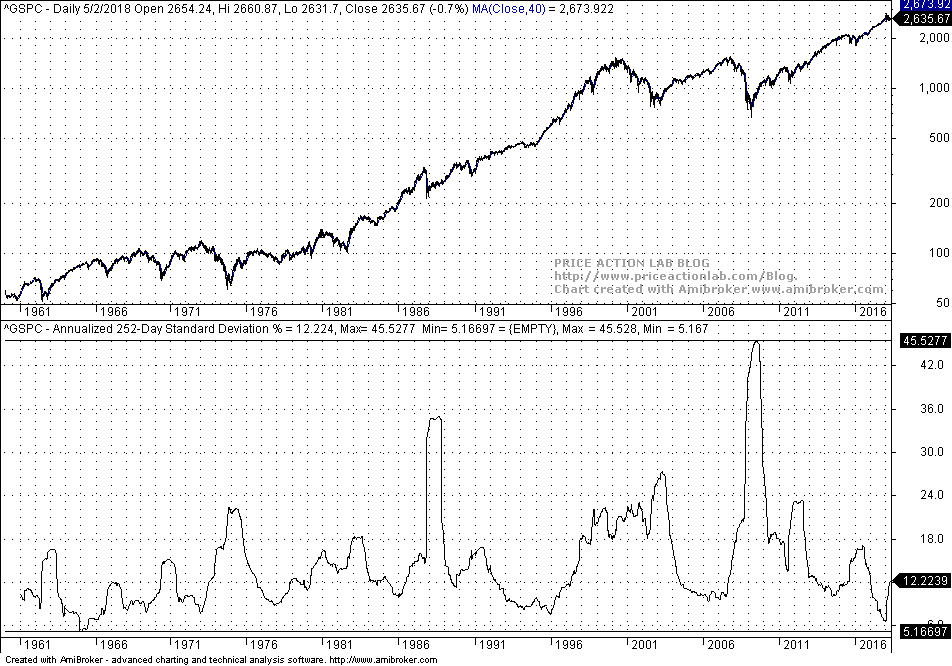
Although the annualized standard deviation fell below 7% late last year, the minimum was just above 5% in the 1960s. Then, also according to this metric last year was not the quietest period in the stock market.
The third metric looks at the count of low daily returns in a rolling 252-day window, less than 0.5% in absolute value.
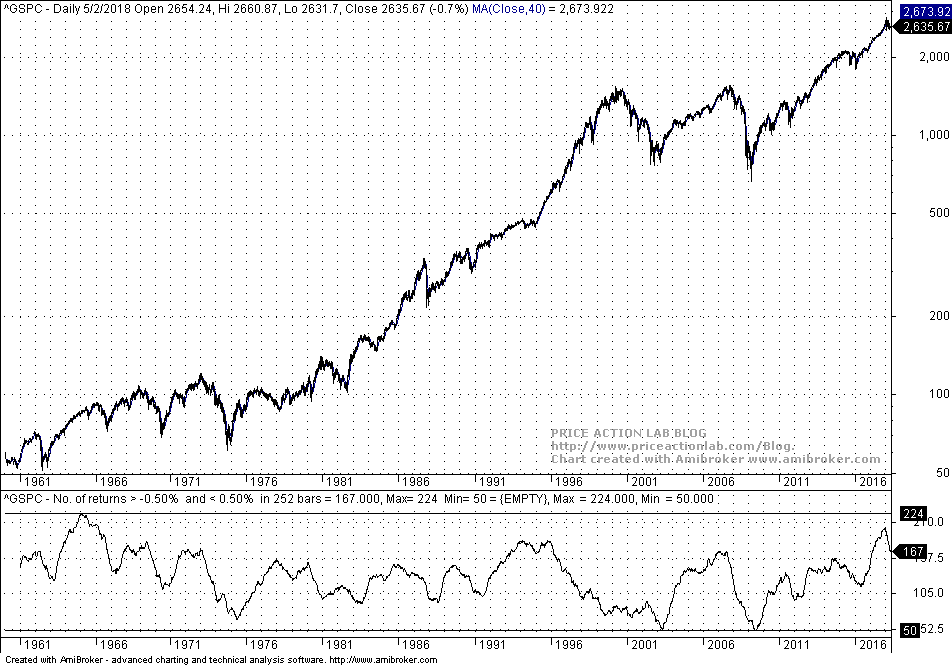
Late last year the count got as high as 202 but in the 1960s it reached a maximum of 224. Then, although the recent count of 202 days in a 252-day window was high, in the 1960s more extreme values were recorded.
Therefore, according to all three metrics used above, last year was not the quietest period in the stock market recent history despite all those articles and posts in social media. Things can get even quieter as history has shown even when there were no algos, QE and buybacks. It probably has to do with risk aversion and psychology.
If you found this article interesting, I invite you follow this blog via any of the methods below.
Subscribe via RSS or Email, or follow us on Twitter
If you have any questions or comments, happy to connect on Twitter: @mikeharrisNY
Charting and backtesting program: Amibroker
Technical and quantitative analysis of Dow-30 stocks and 30 popular ETFs is included in our Weekly Premium Report. Market signals for longer-term traders are offered by our premium Market Signals service.


