


The chart below shows that about 40% of the growth of $1 invested in Amazon stock since 2012 was due to four daily returns in excess of 10%
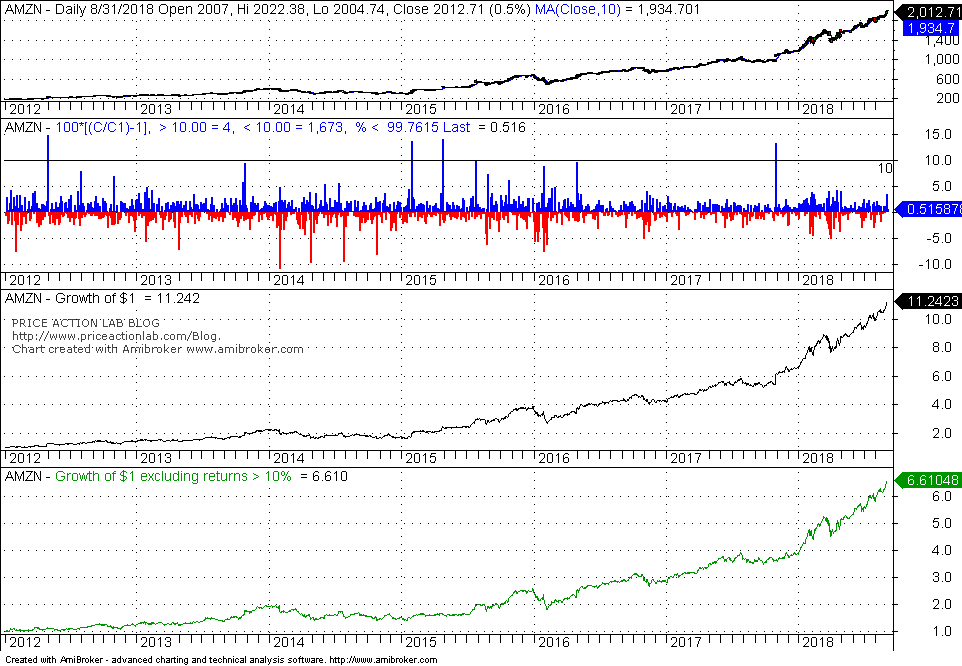
The top indicator chart shows daily returns since 01/2012. There are only four returns in excess of 10%.
The next chart shows the growth of $1 of the stock since 01/2012, which is $11.24.
The bottom chart shows the growth of $1 since 01/2012 if the four returns greater than 10% are set to 0%. The result is $6.61.
Therefore, 41% of the stock growth can be attributed to those four returns greater than 10%.
The conclusion is that in stocks with such return profile, only buy and hold works. Short-term and position traders on the average probably missed some of the large returns and their profits were lower as a result.
Or in other words, some return distributions with long right tails benefit only buy and holders and penalize short-term traders except the lucky or sophisticated ones.
If you found this article interesting, I invite you follow this blog via any of the methods below.
Subscribe via RSS or Email, or follow us on Twitter
If you have any questions or comments, happy to connect on Twitter: @mikeharrisNY
Charting and backtesting program: Amibroker
Technical and quantitative analysis of Dow-30 stocks and 30 popular ETFs is included in our Weekly Premium Report. Market signals from systematic strategies are offered in our premium Market Signals service.


