


This month’s large stock market drop is a reminder that most seasonality statistics are worthless random results. Yet, some websites charge s fee for such statistics. One of the first step in becoming a successful trader or investor, or even both, is to start scrutinizing such statistics and realizing that those who tout them are often naive.
The large drop this month so far serves as a good example of how random are some seasonality statistics.
Let us for example look at statistics for the month of December as of the close of last year:
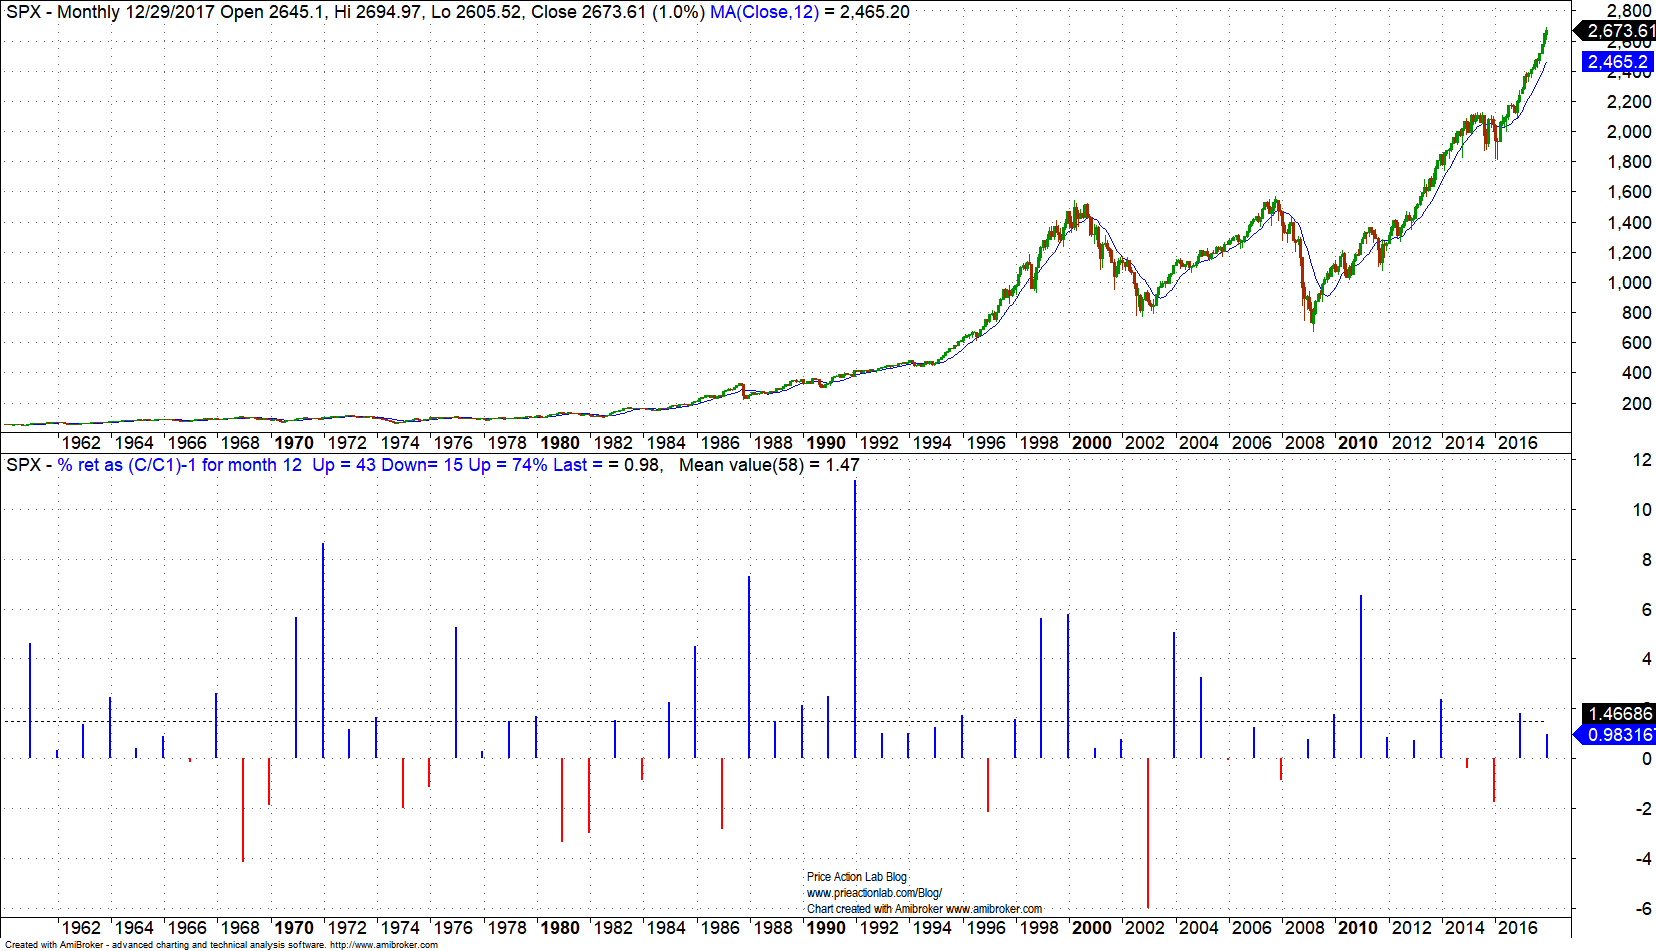
The mean December return was 1.47% and this resulted in the month with the highest mean return since 1960 with November coming second with a mean return of 1.40%. Worst December return was -6.03% in December 2002.
Now we may see how these statistics changed after the recent drop:

So far the return for December is -12.45%, more than double the maximum December return in previous chart. The mean return has dropped to 1.23% and now December is not the top month as far as performance.
Below is a monthly chart with returns for all months:
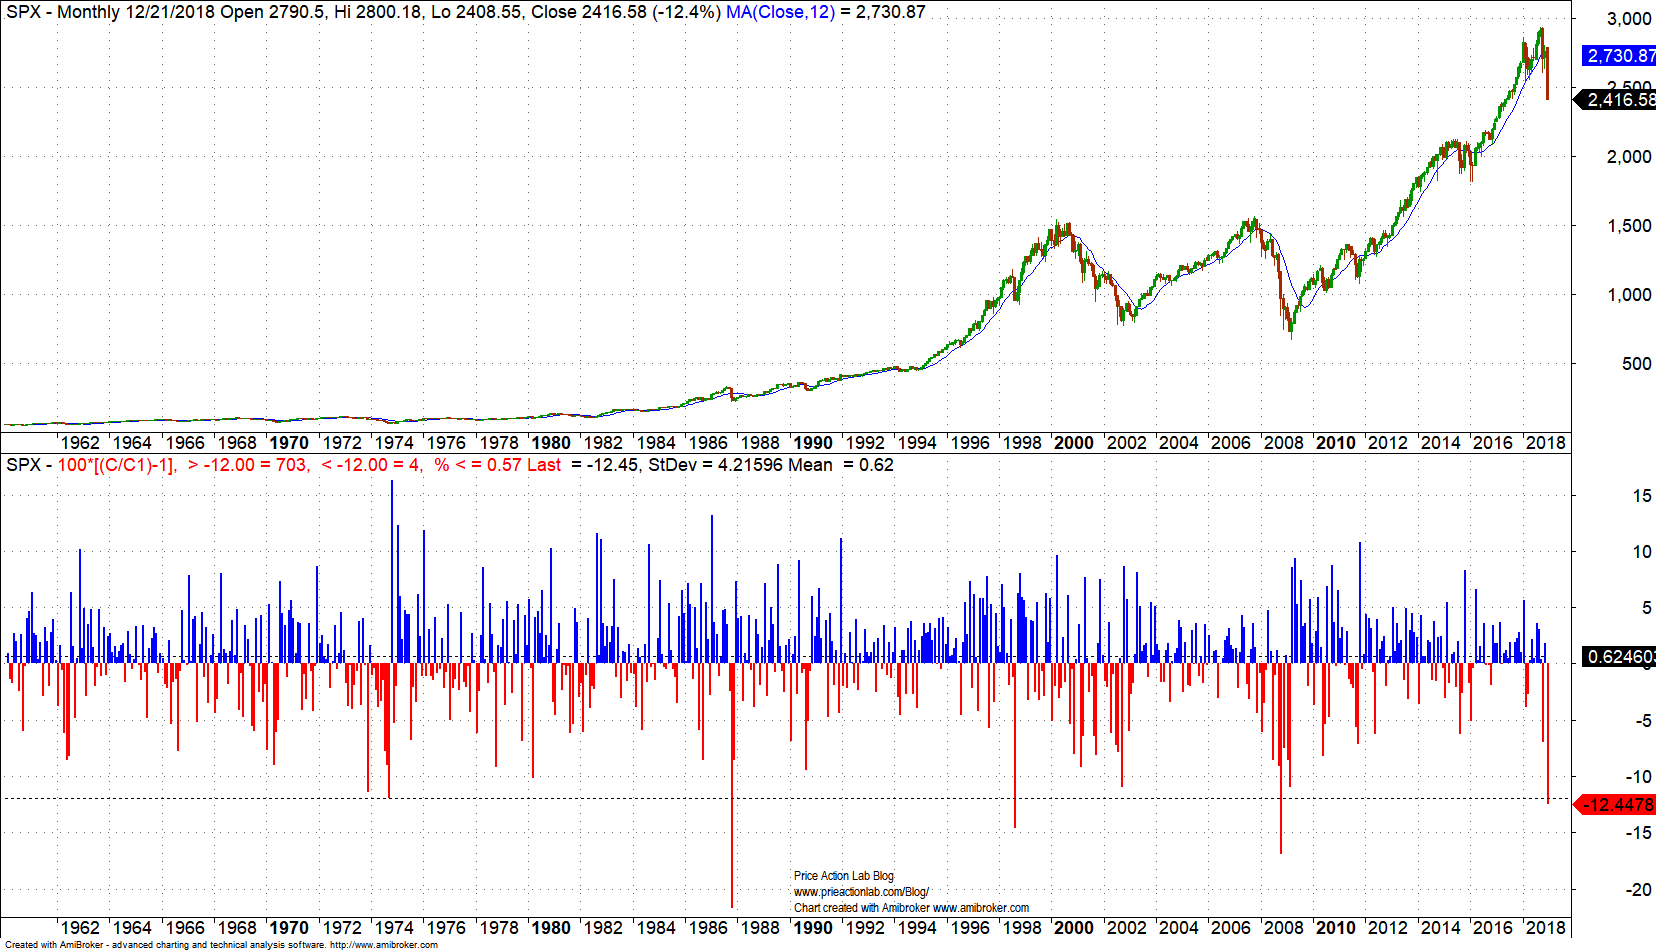
This December’s drop so far is fourth-worst after the 1987 crash, 1989 Ruble crisis and 2008 financial crisis drops of more than 12%, as shown in above chart. Mean monthly return is 0.62% but standard deviation is 4.22% due to the high variance.
Seasonality statistics often suffer from
- Limited samples
- Noise in price series
- Hindsight and data-mining bias
For the above reasons seasonality statistics are in most cases random and worthless for any trading or investing decisions. In finance, due to complexity and high dimensionality, one would need thousands or even millions of data points to start drawing any statistically significant conclusions about expectations and probabilities.
Now, talking about probabilities, obviously the historical hit rate is not the probability of an up month. For example, before 2018, the hit rate for December was 74%. After a large drop this month, it is still 73%. This is to show that hit, or win, rates without an attached payoff are worthless. Many in financial media and blogosphere seem not to understand this. If for example the hit rate is 95% but for the remaining adverse 5% the loss can be 50%, then this is a worthless metric. One of the first steps for investment and trading success is to understand the misunderstandings surrounding probability. Very few people take probability and statistics courses and an even smaller number understands them. Just because someone is in finance business do not assume they understand the use of probability in finance. The huge number of articles and blogs that convey these misunderstandings is proof of this.
If you found this article interesting, I invite you follow this blog via any of the methods below.
Subscribe via RSS or Email, or follow us on Twitter
If you have any questions or comments, happy to connect on Twitter: @mikeharrisNY
Charting and backtesting program: Amibroker
Market signals from systematic strategies are offered in our premium Market Signals service. For all subscription options click here.


