


It is important to understand the data and especially identify any regime changes before developing investment and trading strategies. Otherwise there is potential for both false positives and false negatives.
Understanding the data is the most difficult and time consuming part of investment and trading strategy design. Yet, few do it primarily because it is boring task and on top requires some insight into price action.
For example, longer-term investors are constantly presented with results from momentum strategies going back 100 year or longer. Are these results relevant in markets dominated by algo trading? Usually the reaction is that human behavior stays he same but this is what the developers have to prove in the first place taking also into account that nowadays humans are only a small fraction of market participants. It appears that human behavior has changed even in the last 10 years due to social media and other tech advancements. The appeal to an invariant factor must be proven and the burden of proof is with those who invoke it. They may be right but they have not proved it in any rigorous way.
In trading strategy development the effects of regime changes have a more dramatic effect and can result in false positive (Type-I) and false negative (Type-II) errors. Both of those errors impact performance and often a false negative (missed discovery) may even be more damaging.
For example, since ETFs are relatively new market products, many use underline indexes to develop strategies and the most popular is the S&P 500. Visually at least, since the launch of SPY in 1993 that marked the ETF era, this product and the index appear to move together close enough. But how close is that?
The chart below shows the difference of the daily returns of S&P 500 and SPY (adjusted data) when those daily returns diverge in sign.
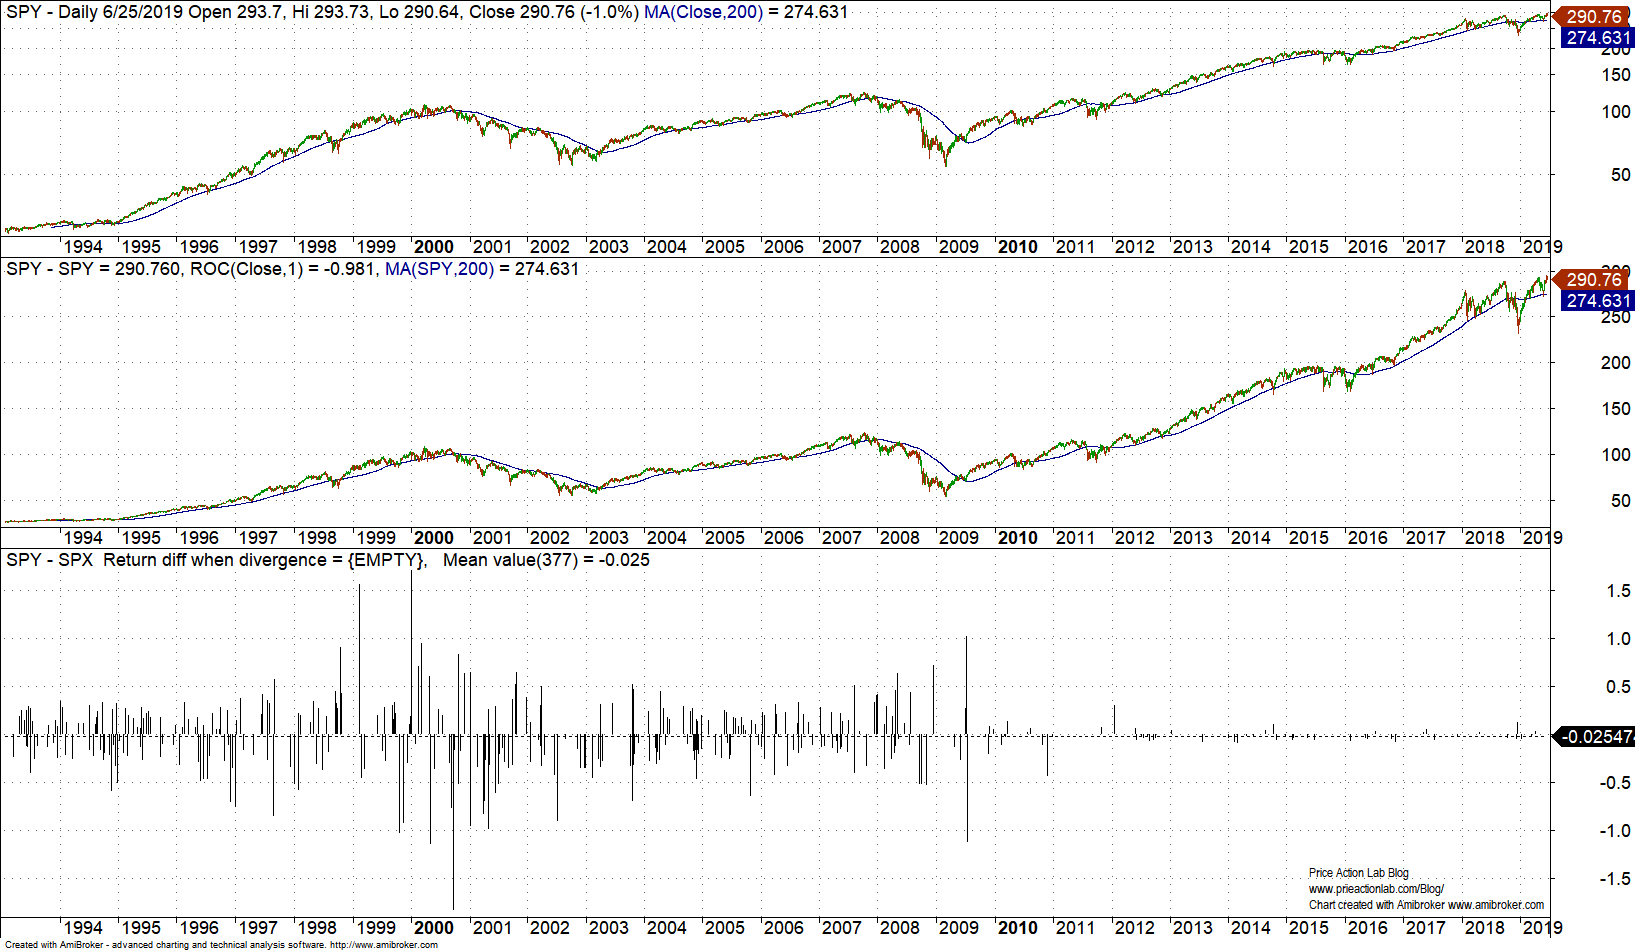
Two immediate observation may be made from the above chart:
- In the last 6649 trading days since SPY inception, there have been divergences in daily returns 377 times, or about 6% of the time.
- The divergence pattern is more prevalent before 2010 with wide swings as large as 1.5% in both directions.
- After 2010 there only 55 divergences have occurred (2.3% of the time) and the index and ETF appear to move more smoothly together.
One issue that emerges from the above analysis is the relevance of using S&P 500 data, which is an untradeable index, in developing strategies with data before 2010 and especially before 1993 since we do not even have a tradeable ETF. Let us look at a specific example of a Type-II error, or missing a good strategy (at least until recently) due to using index instead of ETF data.
The strategy is simple and based on the Internal Strength Bar indicator. Below is a backtest with S&P 500 data from 01/29/1993 to 06/26/2019.

The equity performance is not acceptable, especially due to the sharp decline during the dot com bear market. The performance of this strategy is statistically indistinguishable from that of buy and hold.
Below is the backtest of the same strategy using SPY data in the same period.
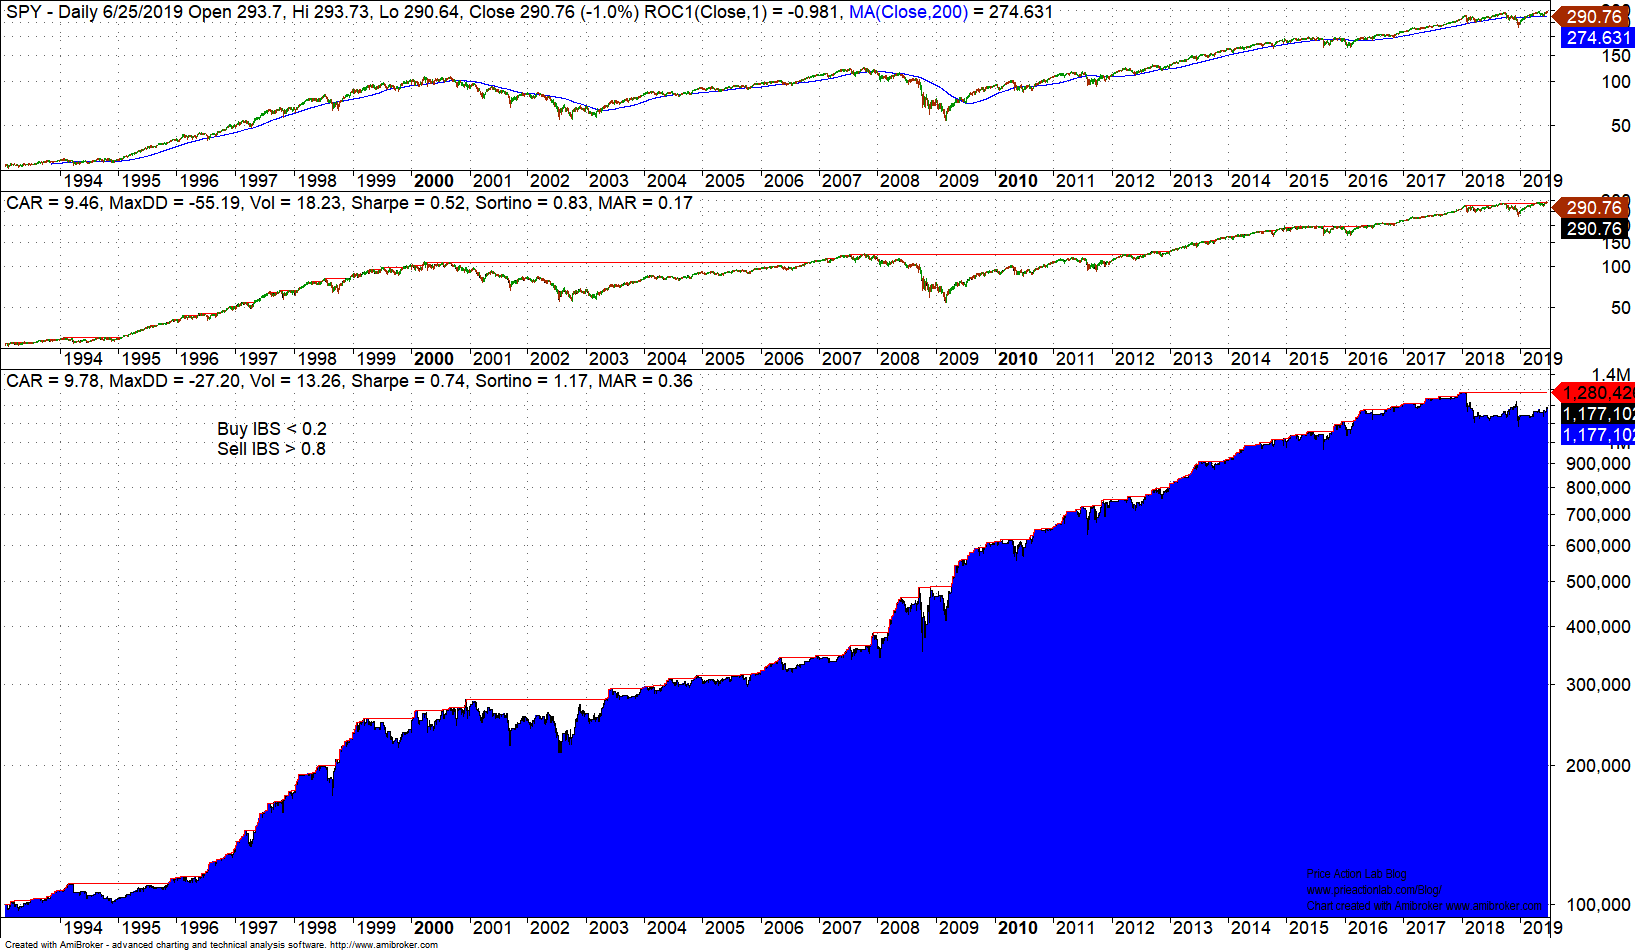
The strategy outperforms buy and hold on both absolute and risk-adjusted basis even after including commission of $0.01 per share. This has been a good strategy until recently but it became too popular and I doubt it will ever work well again as in the past as long as many try to use it.
The difference between the above two backtests may be explained on the basis of the divergences between the ETF and the index before 2010 shown above. This is one example only that shows how important is to understand the data. Otherwise, it is easy to get fooled by random regime changes and other data effects. This is one reason that automated strategy design and implementation is a fool’s errand. Strategies must be studied carefully by analysts with market experience. There is no gold in hands-off data-mining.
Finally, one problem with using data after 2010 is the fact that they represent only a specific market regime and unlikely to repeat in the future. This is another problem and there are some solutions but are outside the scope of the brief article.
If you found this article interesting, I invite you follow this blog via any of the methods below.
Subscribe via RSS or Email, or follow us on Twitter
If you have any questions or comments, happy to connect on Twitter: @mikeharrisNY


