


Part of this article allows free access and part is restricted for subscribers only.
S&P 14-week RSI is about to reach the 80 level as already announced in multiple tweets and social media posts.
Two years ago, on January 26, 2018, the 14-week RSI reached as high as 90.5 and that was followed by a 10% correction in the index.
Are expectations of a repeat of the 2018 pattern due to recency bias?
Below is a weekly chart of S&P 500 since 1960 with RSI(14) that also includes a plot of levels above 80 only.
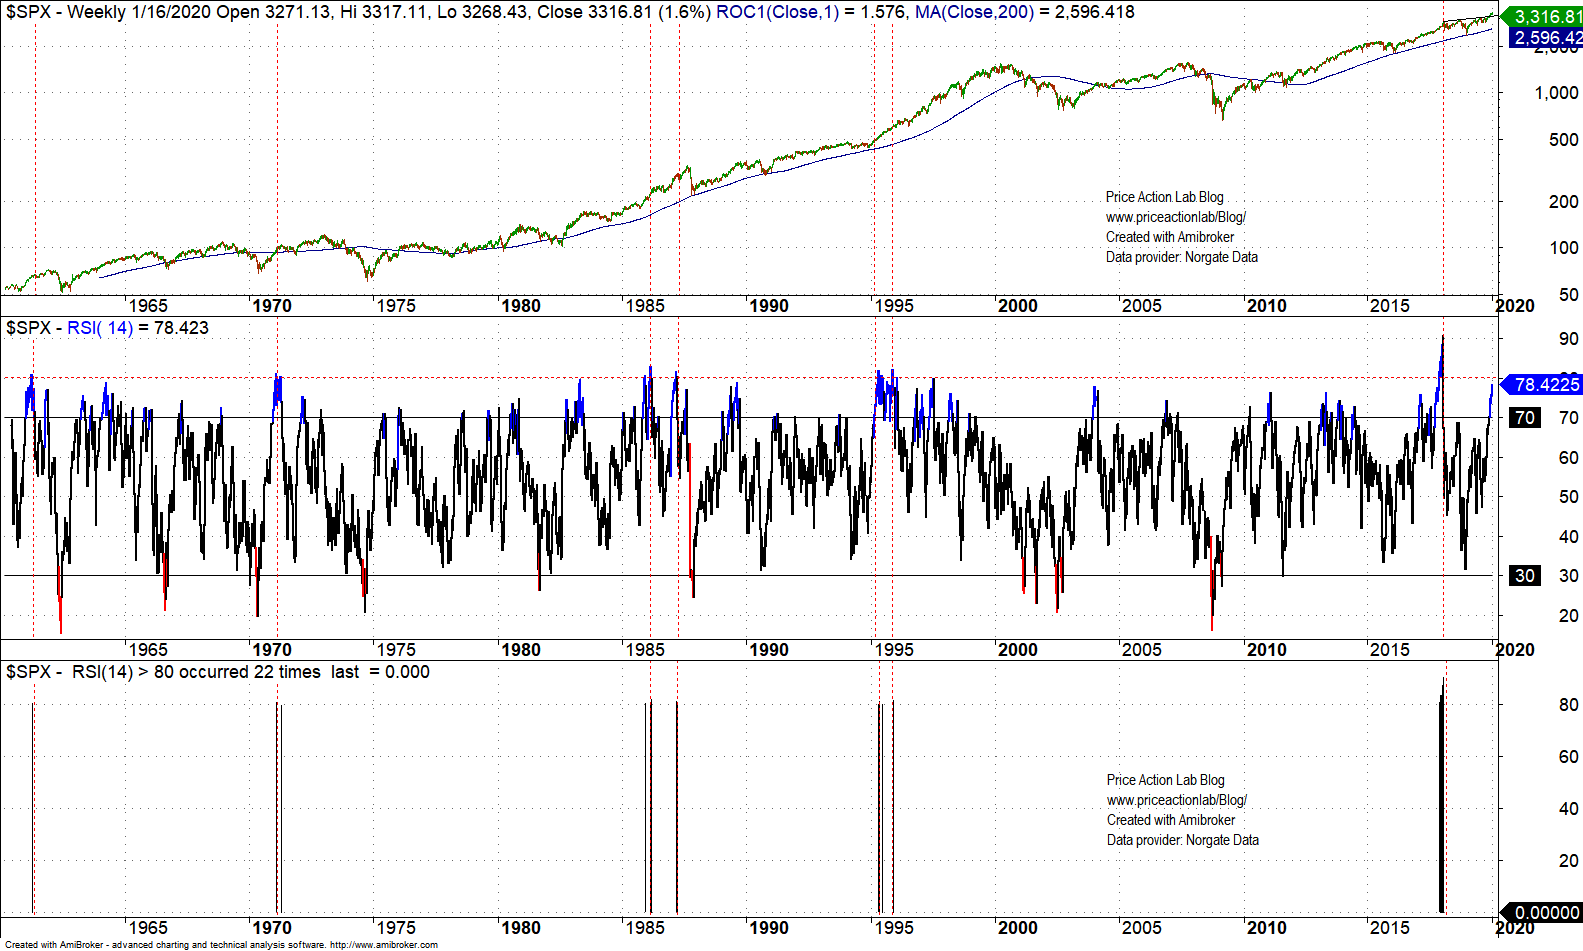
Visual examination of the chart shows that these overbought levels can occur before corrections, major or minor, but also along strong uptrends.
For example, the 14-week RSI reached 81 level 35 weeks before the 1987 crash. Depending on time frame, this can be perceived as continuation or reversal signal.
During 1995 there were multiple occasions of this indicator reaching above 80 but there was no major correction until 1998.
Visual analysis indicated that what occurs after an overbought 14-week RSI signal above 80 depends on context. This is also true with most classical technical analysis indicators. Furthermore, “context” is also too general and can mean different things for different people. For these and other reasons, technical analysis creates both buyers and sellers and this was always good for the sell side.
Our conclusion about the proper use of this indicator based on detailed backtests follows below for premium subscribers. Access to article requires All in One, Market Signals or Premium Articles subscription.
|
This post is for paid subscribers
Already a subscriber? Sign in |
Specific disclaimer: This report includes charts that may reference price target levels determined by technical and/or quantitative analysis. No updates to charts will be provided if market condition changes occur that affect the levels on the charts and/or any analysis based on them. All charts in this report are for informational purposes only. See the disclaimer for more information.
Disclaimer: No part of the analysis in this blog constitutes a trade recommendation. The past performance of any trading system or methodology is not necessarily indicative of future results. Read the full disclaimer here.
Charting program: Amibroker
Data provider: Norgate Data
Copyright notice: Any unauthorized copy, reproduction, distribution, publication, display, modification, or transmission of any part of this report is strictly prohibited without prior written permission


