The S&P 500 index fell 15.84% from the all-time high eight days ago to the low of yesterday. This is a six-sigma thunderbolt that has hit the market.
Below is the distribution of S&P 500 negative returns from high to low in a period of eight days.
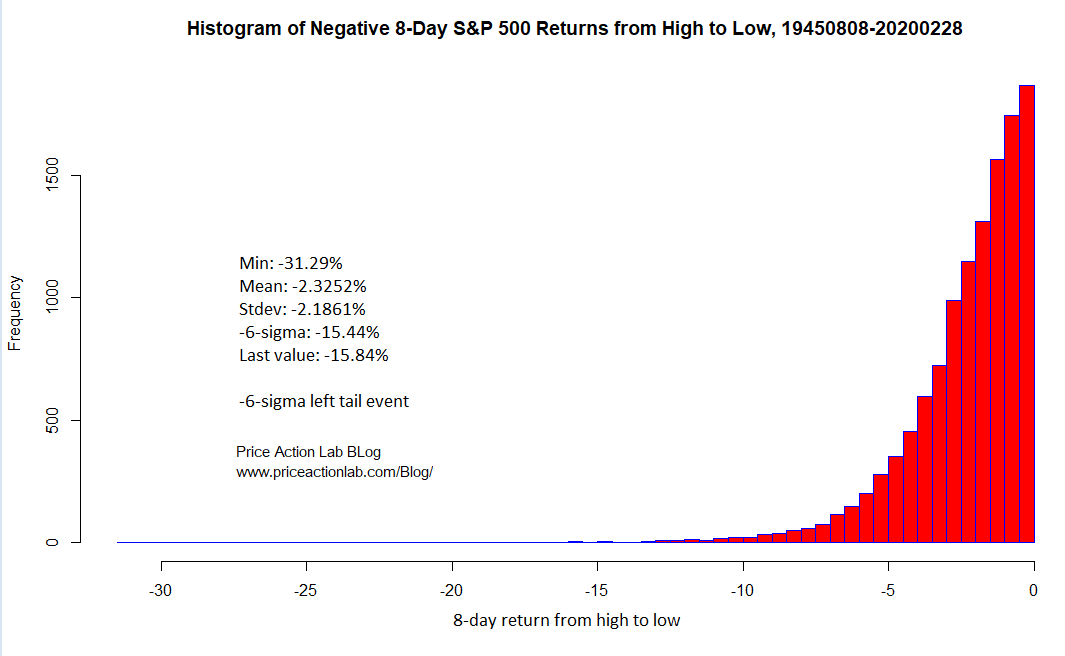
Six-sigma away from the sample mean is at -15.44% while the drop in the last eight days from the all-time high to the low of yesterday is -15.84%. Obviously, the distribution of the population is not known so we are dealing here with the available sample since August 1940 in S&P 500.
Below is the chart in the time domain.
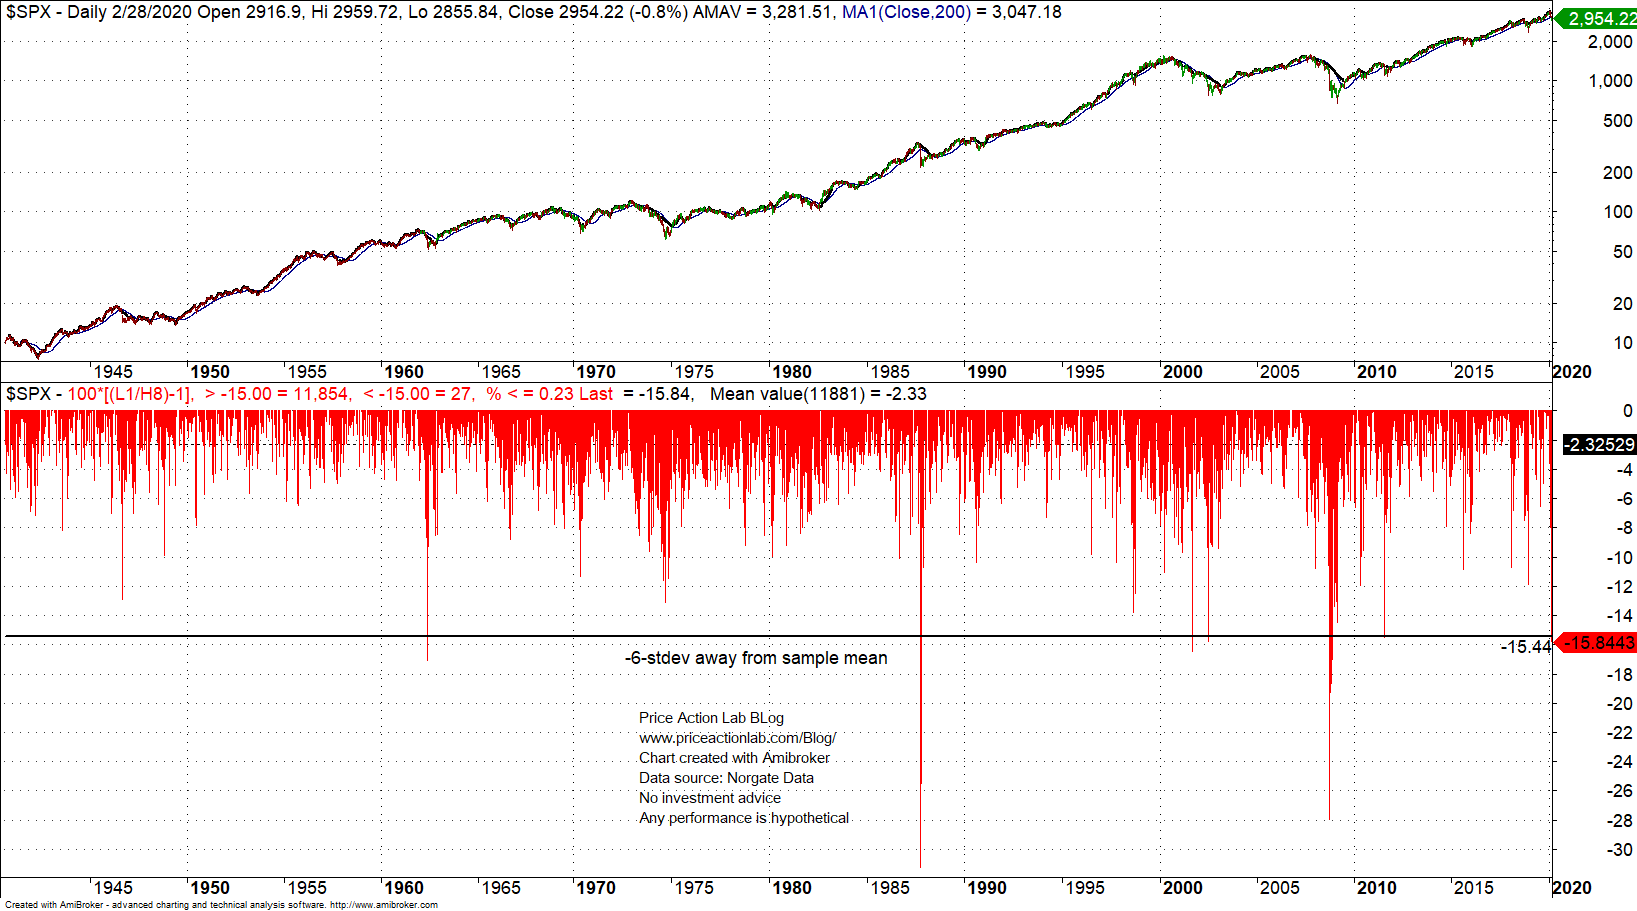
The mean 8-day negative drop from high to low is -2.32% and six standard deviations from the mean is at -15.44%. The index plunged -15.84% from the high to the low in the last eight days since all-time highs.
This is ominous chart and statistics. I am not sure if central banks have enough ammunition to change the medium-term consequences of this drop although in the short-term they may succeed in squeezing out shorts.
Note that one of the outliers, a -28.04% return in eight days, occurred along the 2008 bear market on October 10, 2008 and the market continued to go down afterwards. The other outlier is due to 1987 crash and it is more than 31%.
Let us hope that central banks will succeed in limiting losses but it will be a difficult task as investors may see the rebounds as selling opportunities.
Charting and backtesting program: Amibroker
Data provider: Norgate Data
Technical and quantitative analysis of major stock indexes and 34 popular ETFs are included in our Weekly Premium Reports. Market signals for position traders are offered by our premium Market Signals service
If you found this article interesting, you may follow this blog via RSS or Email, or in Twitter