A 5-sigma left tail event has just occurred in the stock market. But it could be much worse. The 2011 correction delivered even worse performance.
Usually high energy physics uses 5-sigma events to confirm new particles. The 5-sigma events in the stock market are rare but may have higher probability because the distribution is not normal but highly leptokurtic. Obviously, the distribution is not known so we are talking here about the available sample since August 1940 in S&P 500.
Below is the distribution of six-day returns of S&P 500.
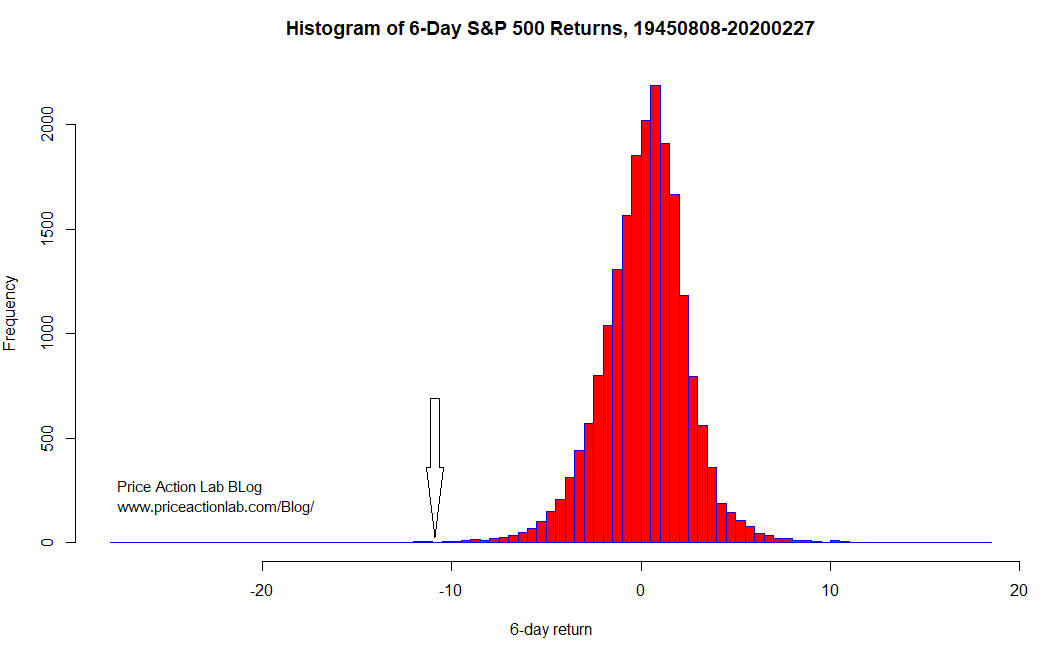
In the last 6 days the index dropped 12.03%. This event is from the far left tail of the above distribution that has kurtosis of about 8.61.
However, as extreme this six-day event as it may sound, it is still not as extreme as a six-day event that occurred during 2011 correction and specifically on August 8, 2011. That six-day return was -13.37% then. The chart below shows a plot of 6-day returns in the time domain.
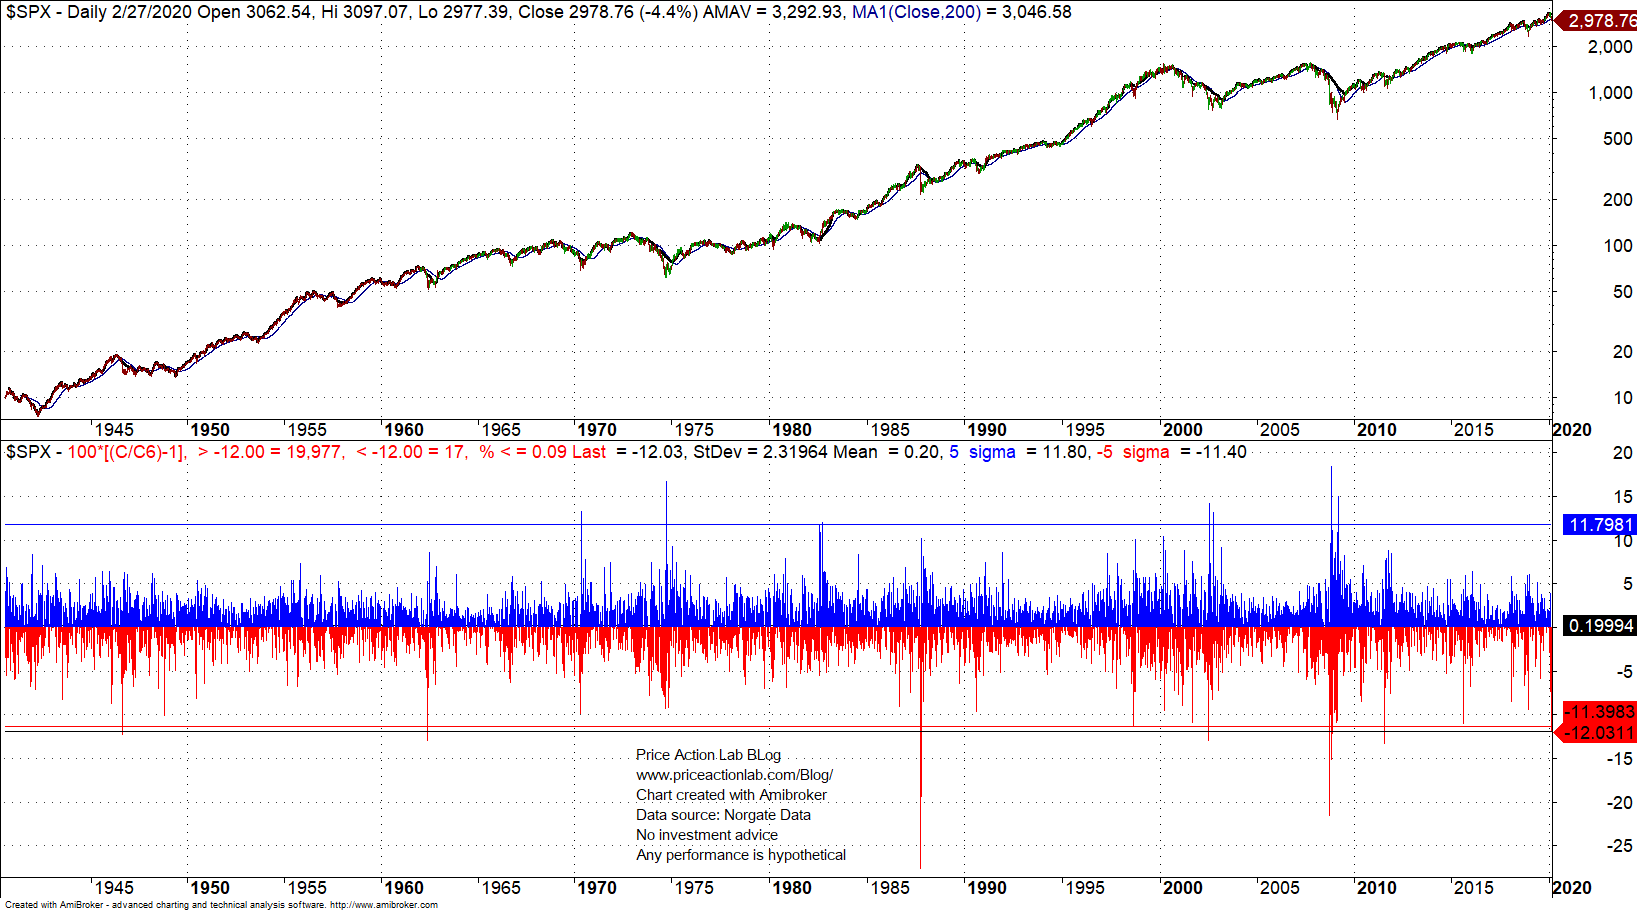
Obviously, the 2008 correction was even more extreme event. There are 17 events with loss greater than 12%, as indicated in the above chart.
Conclusion
– Large corrections occur along corrections. This is obvious but it seems to surprise some people.
– Large corrections are “normal” part of markets. Investors and traders should learn how to live with them in harmony.
– Since 1940, the S&P 500 index has spent 39% of the time more than 10% below all-time highs. Yes, that is 39% of the time. The chart below should convince the skeptic.
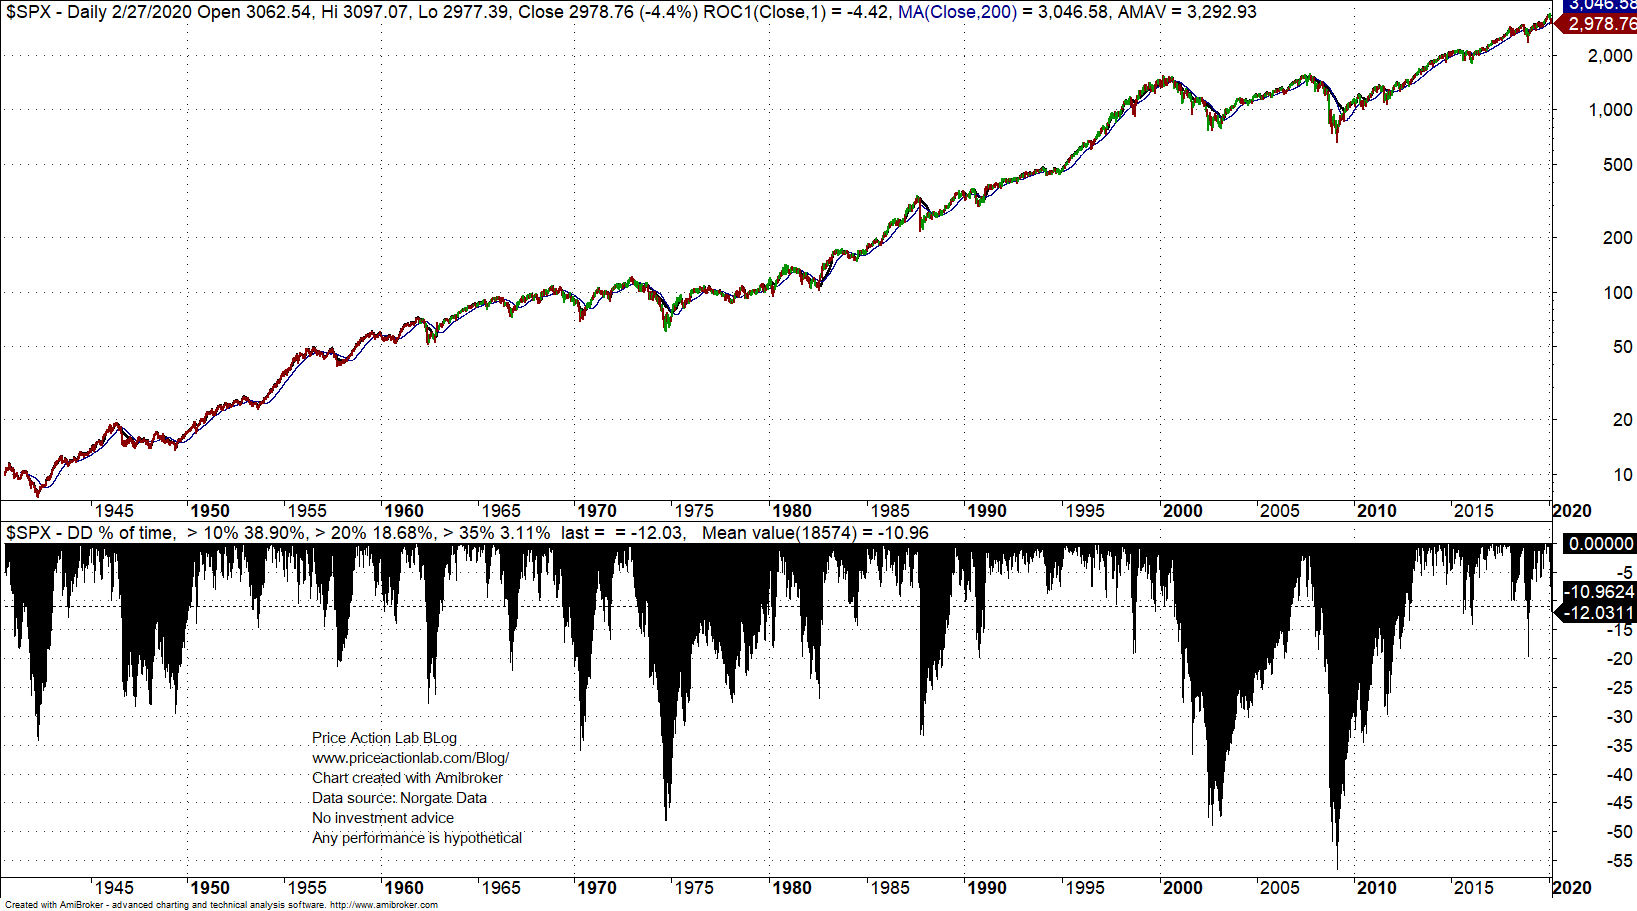
In fact, the average drawdown from all-time highs has been about -11%. This means that about 40% of the time investors have been in corrections similar or even larger than the one that happened in last six days.
I hope the above offer a perspective of the state of the stock market devoid of panic or other motives.
Charting and backtesting program: Amibroker
Data provider: Norgate Data
Technical and quantitative analysis of major stock indexes and 34 popular ETFs are included in our Weekly Premium Reports. Market signals for position traders are offered by our premium Market Signals service
If you found this article interesting, you may follow this blog via RSS or Email, or in Twitter