Crude oil futures plunged 10% on Friday, March 6, 2020, while a rally in bond market caused TLT ETF to surge 5.2%. These are four and six sigma events, respectively.
April Crude oil futures plunged 10.1%, as shown in the continuous contract chart below:
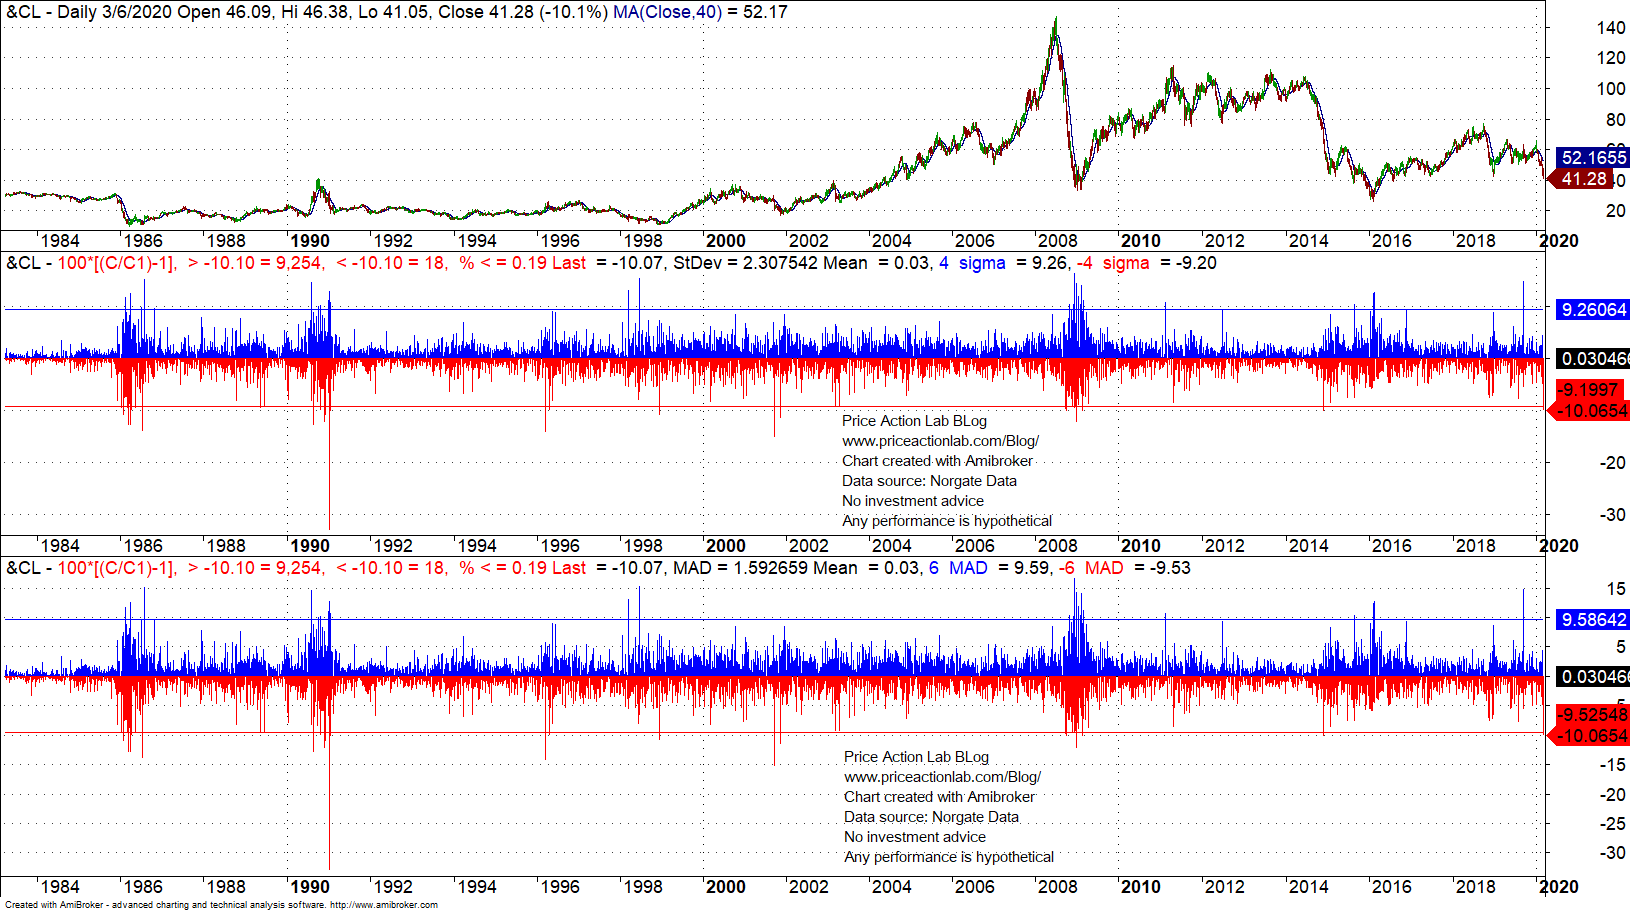
Based on the sample and subject to other approximations due to contract rollovers, this was a -4-sigma and -6-MAD (mean absolute deviation) event.
As it may be seen from the statistics on the above chart, there have been 18 events of a daily drop of 10.1% or larger since 1983. Therefore, these low probability events occur in the oil market.
Kurtosis of daily return distribution is about 12.4. Therefore, this is a highly leptokurtic distribution.
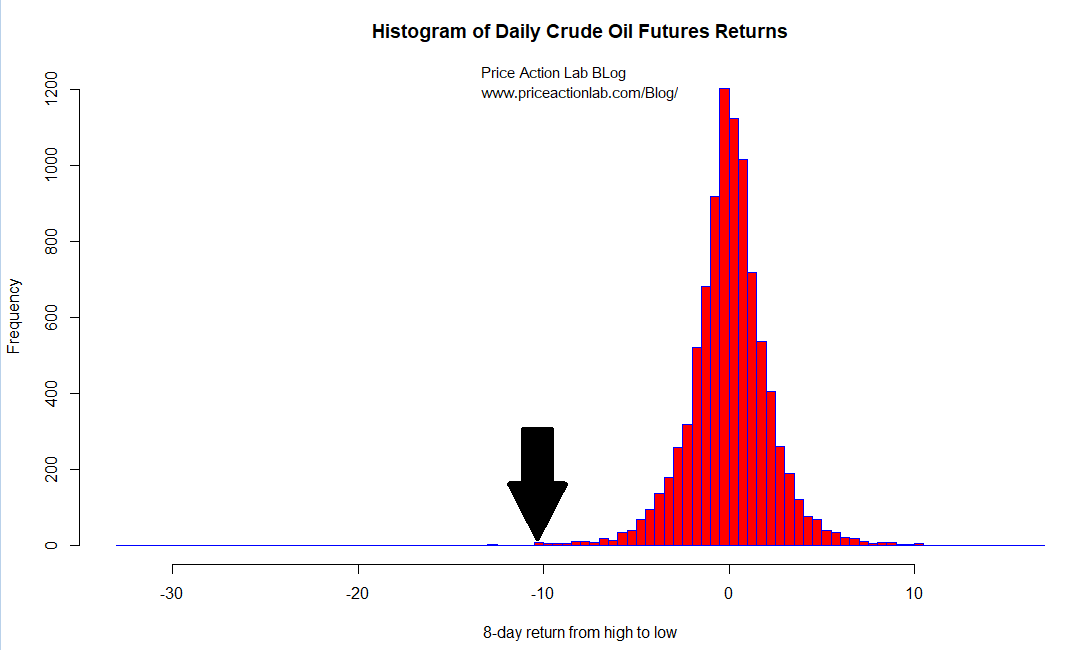
Although the mean of the distribution is about the same of that of S&P 500 daily returns, the standard deviation is about double so this is a much riskier market.
TLT ETF surged 5.2%, the most since November 20, 2008, and before the bottom of the financial crisis bear market.

The TLT daily gain was a 6-sigma or 8-MAD (mean absolute deviation) event based on available sample.
The distribution of TLT daily returns is less leptokurtic than that of crude oil with kurtosis of about 5.1 although mean return is about the same.
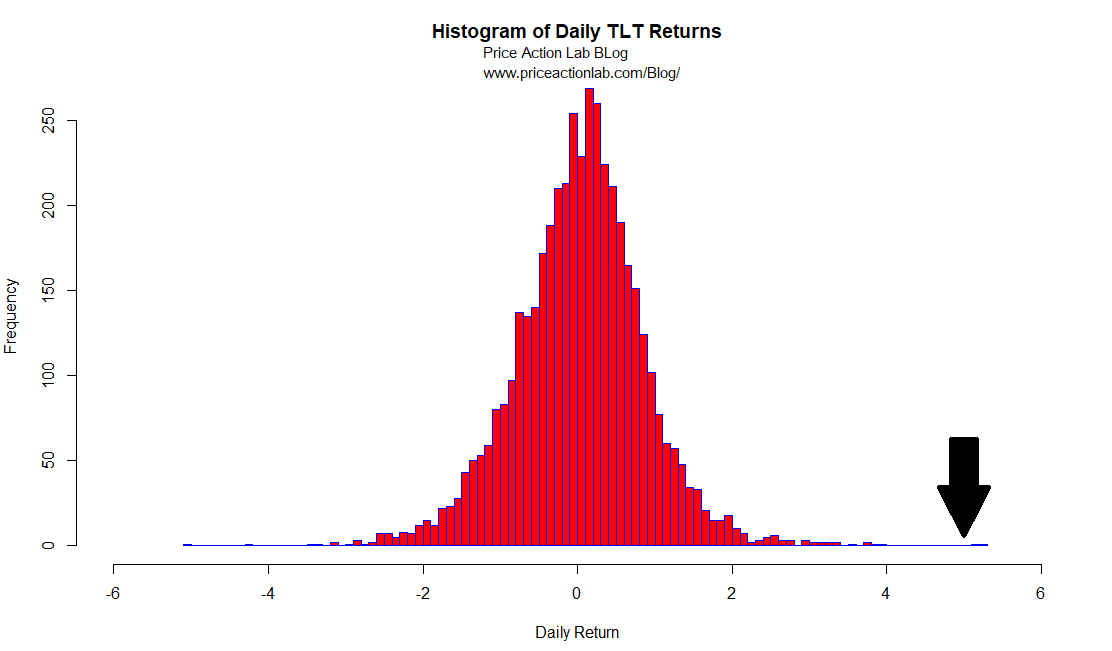
However, there is a caveat here: the TLT sample may not be sufficient. Maybe in the future bonds will turn out to be as risky as crude oil or stocks.
Charting and backtesting program: Amibroker
Data provider: Norgate Data
Technical and quantitative analysis of major stock indexes and 34 popular ETFs are included in our Weekly Premium Reports. Market signals for position traders are offered by our premium Market Signals service.
If you found this article interesting, you may follow this blog via RSS or Email, or in Twitter