


Everyone who follows my blog in last ten years knows I have been a critic of naive momentum models. In my opinion, this crowded momentum space is the primary cause of the fast market crash with vertical losses in excess of 28% for S&P 500 in the course of only five weeks. Momentum is systemic risk.
There is no reason for analysis paralysis. A few charts will provide the idea of what has happened. Naive long-only momentum models have been popularized by numerous authors, unfortunately some of them academics, in the last 20 years. They go like this:
“Follow the 200-day moving average or the 12-month moving average and sell when price falls below it.”
This is exactly what many did recently in this momentum crowded space where billions of dollars are managed by looking at these averages.
The virus exacerbated the stampede and provided the trigger to get out and reduce exposure to zero: the collateral damage was some hedge funds using different strategies, such as risk-parity, but primarily passive investors.
Under “normal” circumstances, some of those momentum players would have just cut exposure; but they all run to the exit.
This is another example how naive are a danger to the sophisticated. When I took Japanese martial arts courses in college, my sensei (master) with Rokudan (sixth degree black belt) always warned us about the damage that amateurs can do in a fight because of panic. Professionals follow a system or set of rules.
Let us start with some interesting observations. The first chart is the daily S&P 500 with daily returns, point changes and the year-to-date return. The 50-day and 200-day moving averages are also shown on the chart.

The index crashed 28.7% in 22 trading days but still there is no death cross (50-day moving average below the 200-day moving average.) !!!
Momentum does not follow the death cross; this is what TA people do. Momentum follows the 200-day moving average or the 12-month moving average for most part. Some follow the 10-month moving average. Below is the daily chart.

Five days after price crossed below the 200-day moving average selling intensified. The monthly moving average chart shows better what happened.
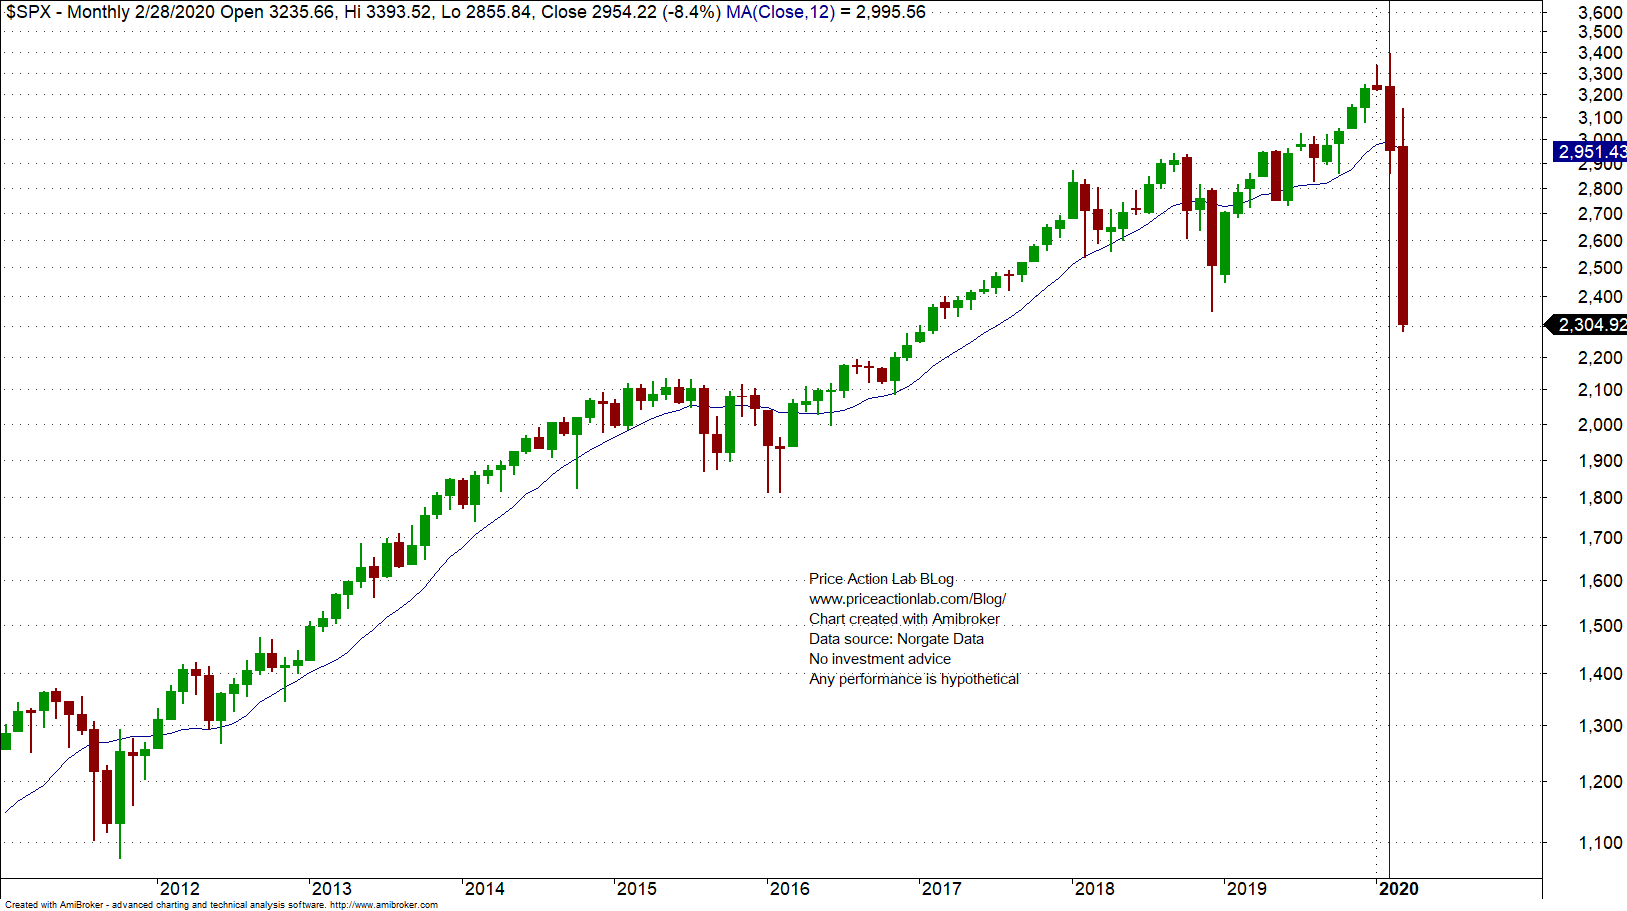
After the 8.4% decline in February and the close below the 12-month moving average, losses for March are now at 22% as of Friday, March 20, 2020.
The above chart shows the stampede to get out after price fell below the 12-month moving average. Momentum, a crowded space that promises longer-term growth at minimum risk, is actually a systemic risk for passive investors and market participants using other more sophisticated strategies.
A herd of naive is always source of risk. But the gains, or the limited losses, cannot hide the risks associated with momentum. These have been discussed in this blog numerous times.
The biggest risk is an extended choppy market after this crash, similar in dynamics to what occurred in emerging markets from 2010 to 2016. Just to give you an idea of the potential losses to naive momentum in case of a seven-year chop, let us look at the performance of the 12-month strategy in EEM ETF from 01/2010 to 12/2016 below.
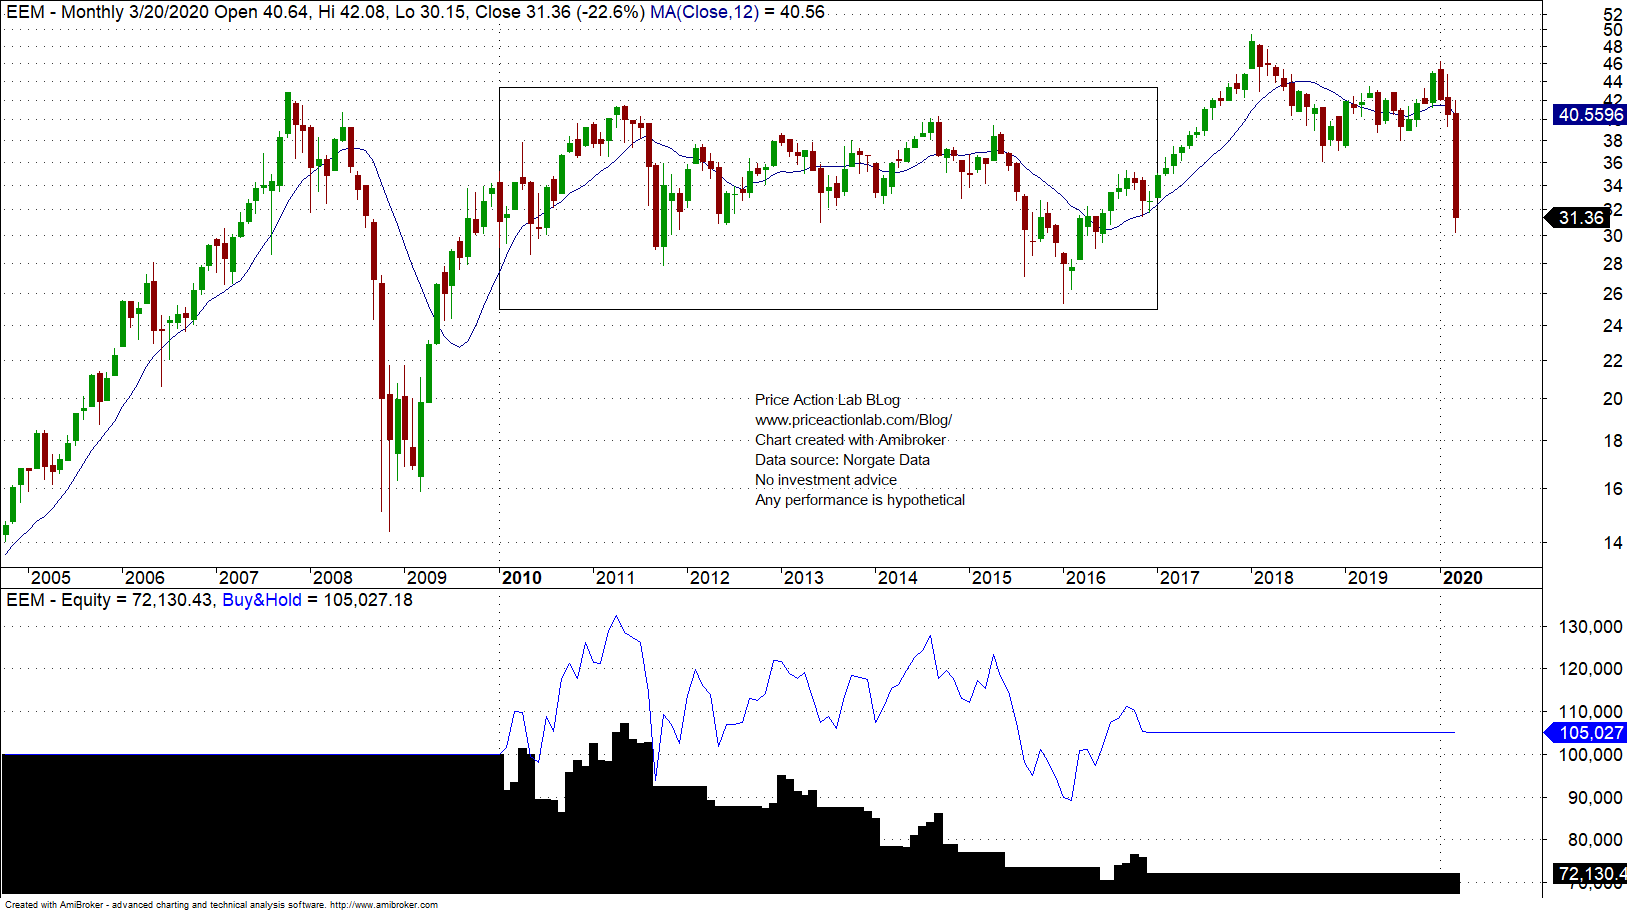
Although buy and hold was about flat, the long-only strategy that buys when price is above the 12-month moving average and sells when it falls below lost about 28% in the course of those seven years!
Unfortunately, naive strategies pose systemic risks. Sophisticated traders should take into account this fact. Fund managers should understand that while they are working hard there are funds with billion of AUM that look at some moving averages. The amateur can be a worse enemy than the market volatility.
After this market crash, there will be probably more attention to long/short strategies but in faster timeframes. In fact, we believe that smaller long/short funds with AUM in the rage of $100M – $500M in faster timeframes may be the new vehicles for generating idiosyncratic alpha. Large funds can no longer compete in an environment where naive momentum players using moving averages brag they got out with only 8% loss. while in reality they exacerbated a market crash. This is self-fulfilling prophecy and systemic risk.
Charting and backtesting program: Amibroker
Data provider: Norgate Data
If you found this article interesting, you may follow this blog via RSS or Email, or in Twitter

Price Action Lab Blog Premium Content


