


The S&P 500 index surged 7% yesterday and the first calls of a V-bottom recovery surfaced in financial media and blogosphere. However, a repeat of the 2008 pattern is a possibility. Relevant charts are included.
As the chart below shows, the S&P 500 surged 7-standard deviations and 10-MAD (mean absolute deviations) yesterday. The standard deviation and MAD are calculated based on the available sample since 1940.
Note that there is widespread misconception about the use of these quantities in financial blogosphere and social media. In a nutshell, these are descriptive statistics of the sample. The population statistics are not known but this does not prevent us from using these sample statistics to rank daily returns in a historical sense as long as we are not using them to make inferences about probabilities.
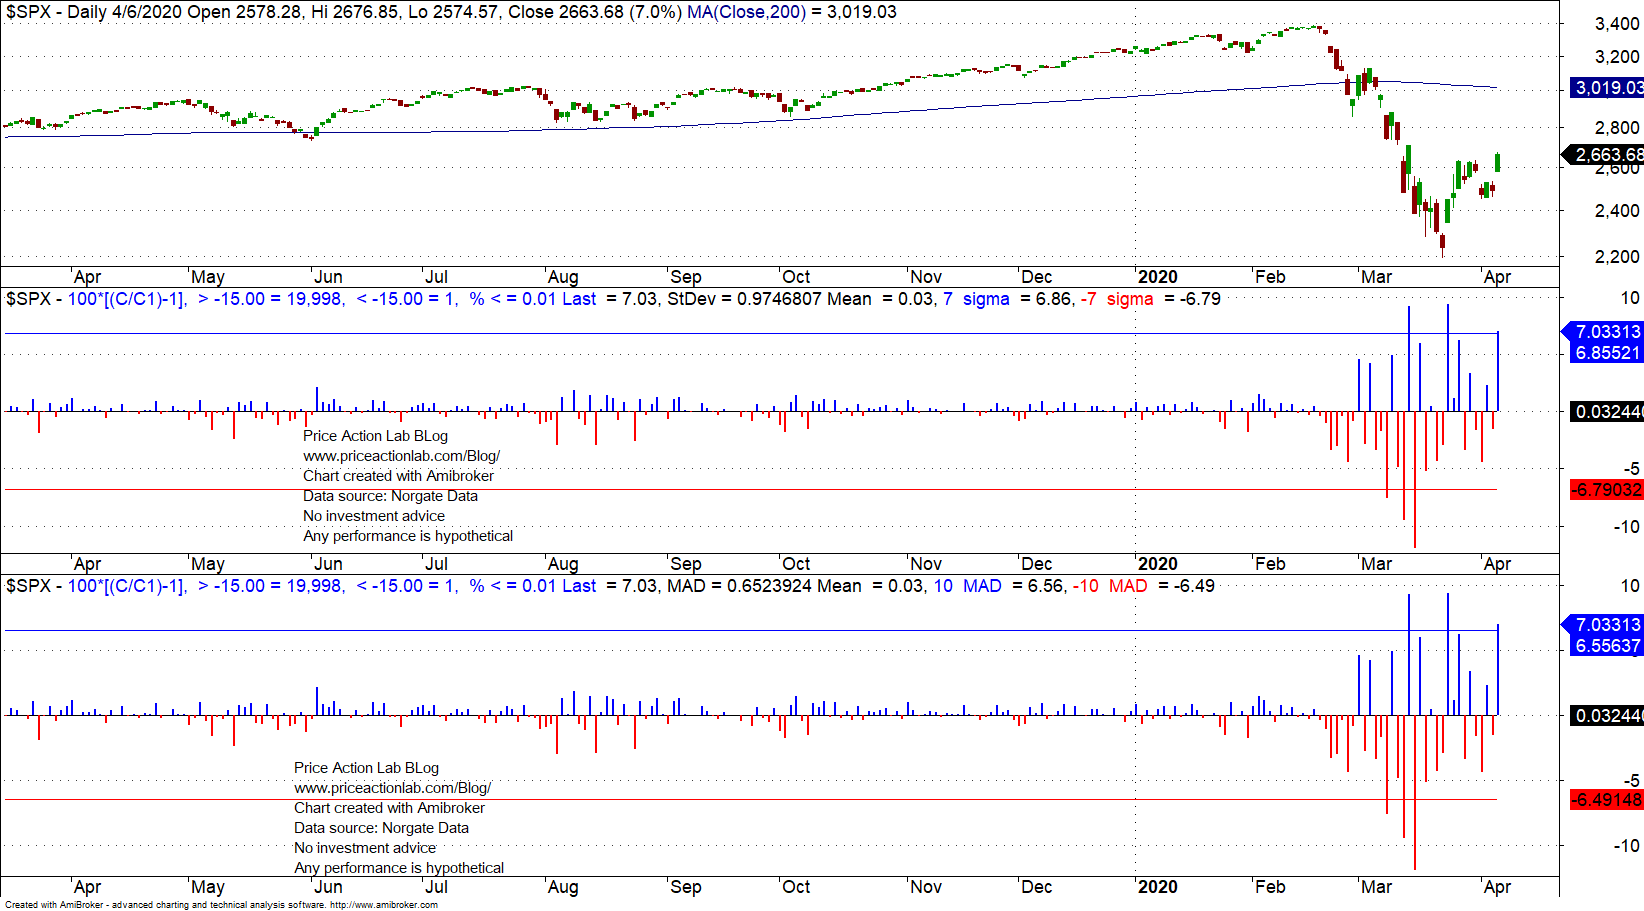
The interesting observation is that since the market downtrend started, there have been equal numbers of positive and negative events above and below 7-standard deviations and 10-MAD. Despite that, the S&P 500 index is down 21.3% from the all-time high. This is because extreme positive events occur along downtrends with much higher frequency than in uptrends, also known as “bear market rallies.”
After the rally yesterday, the first calls about a V-bottom surfaced in financial media and blogosphere. However, the 2008 scenario is a possibility. What happened in 2008 is shown in the chart below.
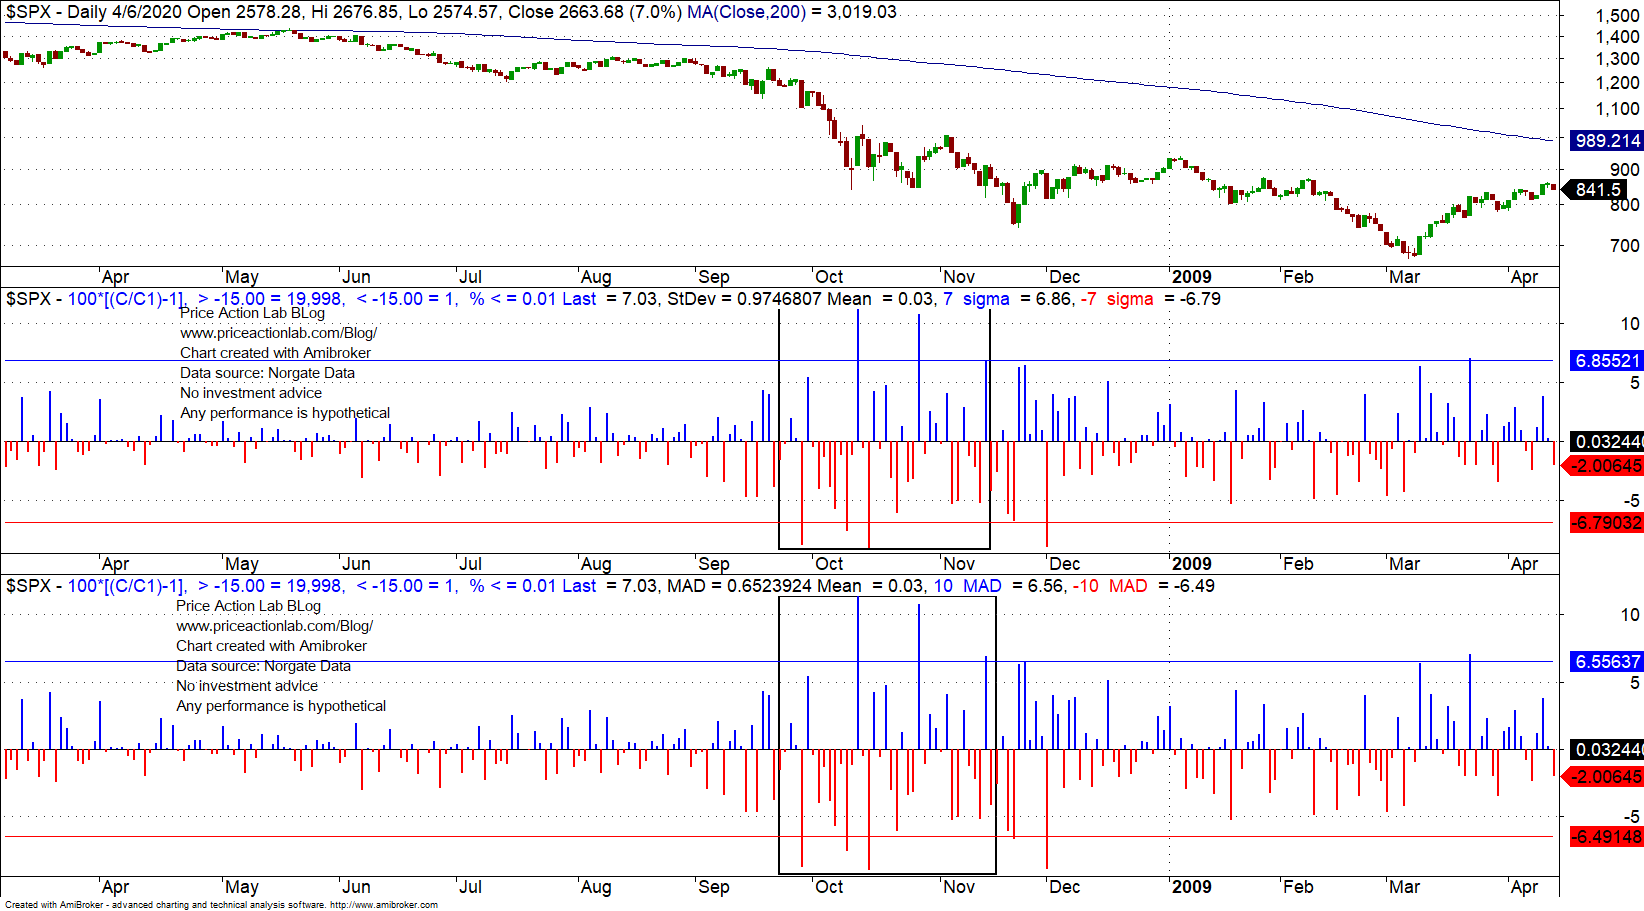
From late September to mid November 2008 there were also three positive events above 7-standard deviations and 10-MAD to match three negative events below those levels. Then the market fell more than 30% to the bottom of March 6, 2009.
In my opinion it is quite premature and even immature to call a V-bottom here although that would be desirable. Forecasts under conditions of high uncertainty are basically a coin toss (this can be proven mathematically.) Therefore, most of those who make those forecasts use a 100% biased coin that probably reflects wishful thinking.
Charting and backtesting program: Amibroker
Data provider: Norgate Data
If you found this article interesting, you may follow this blog via RSS or Email, or in Twitter

Price Action Lab Blog Premium Content


