


The percentage of NASDAQ-100 stocks above their 50-day moving average reached as high as 99% on May 29, 2020. It may be important to take into account context and selection bias when looking at these breadth indicators.
The chart below shows the percentage of NASDAQ-100 stocks above their 50-day and 100-day moving averages as of the close of June 2, 2020.
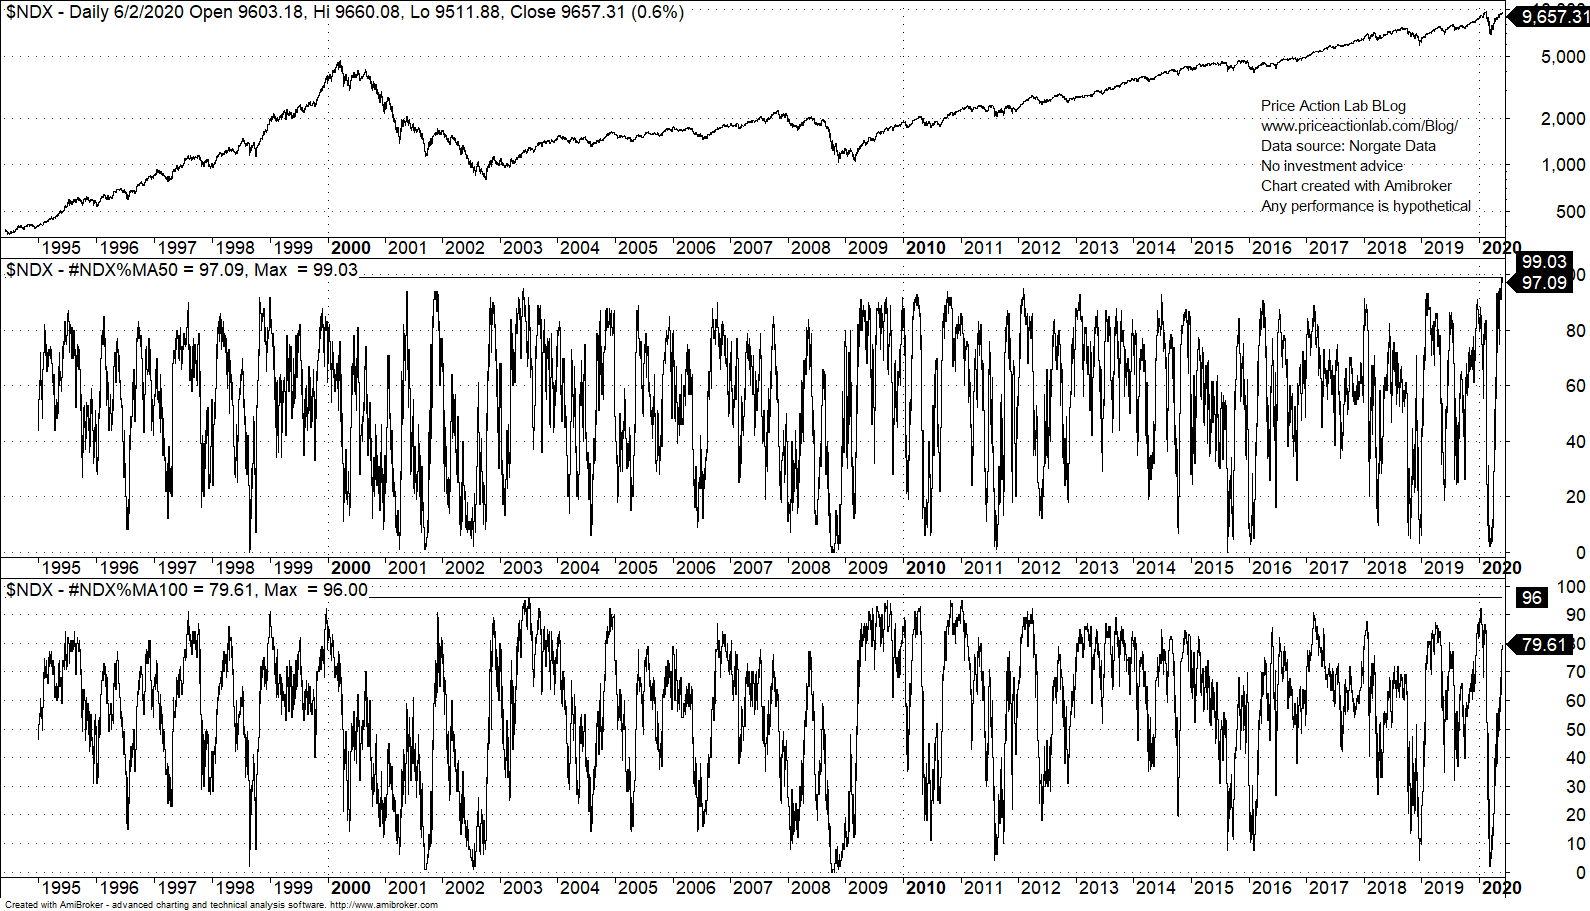
By close of last week, the percentage of stocks above the 50-day moving average reached the highest level since 1995 at 99.02%. This prompted some analysts to declare NASDAQ-100 highly overbought.
However, the percentage of stocks above their 100-day moving average was at 77.67% and much below the highest level since 1995 at 96%.
The market does not make choices between 50-day and 100-day moving averages; this choice is only made by analysts often due to wishful thinking and selection bias.
The index is up 1.1% since the close of last week. Markets usually ignore simple breadth indicators that measure momentum in most cases. Markets can stay overbought for longer than those breadth indicators signal a reversal according to some analysts. Context is always important. After a sharp decline in 23 days and a quick rebound, these breadth indicators may generate extreme readings that have low significance in forecasting market direction.
Charting and backtesting program: Amibroker
Data provider: Norgate Data
If you found this article interesting, you may follow this blog via RSS or Email, or in Twitter

Price Action Lab Blog Premium Content


