


Overnight changes account for more than 93% of total return since SPY ETF inception. Below are the distributions and related charts along with the simplest possible explanations for this anomaly.
The overnight effect anomaly in SPY ETF has been documented in many articles in this blog in the last 10 years and in many other financial blogs and websites. Since SPY ETF inception, overnight changes (from the close of a day to the open of the next day) have contributed to more than 93% of the total return performance of the ETF while in the past it was at 100%. The chart below illustrates this anomalous behavior.
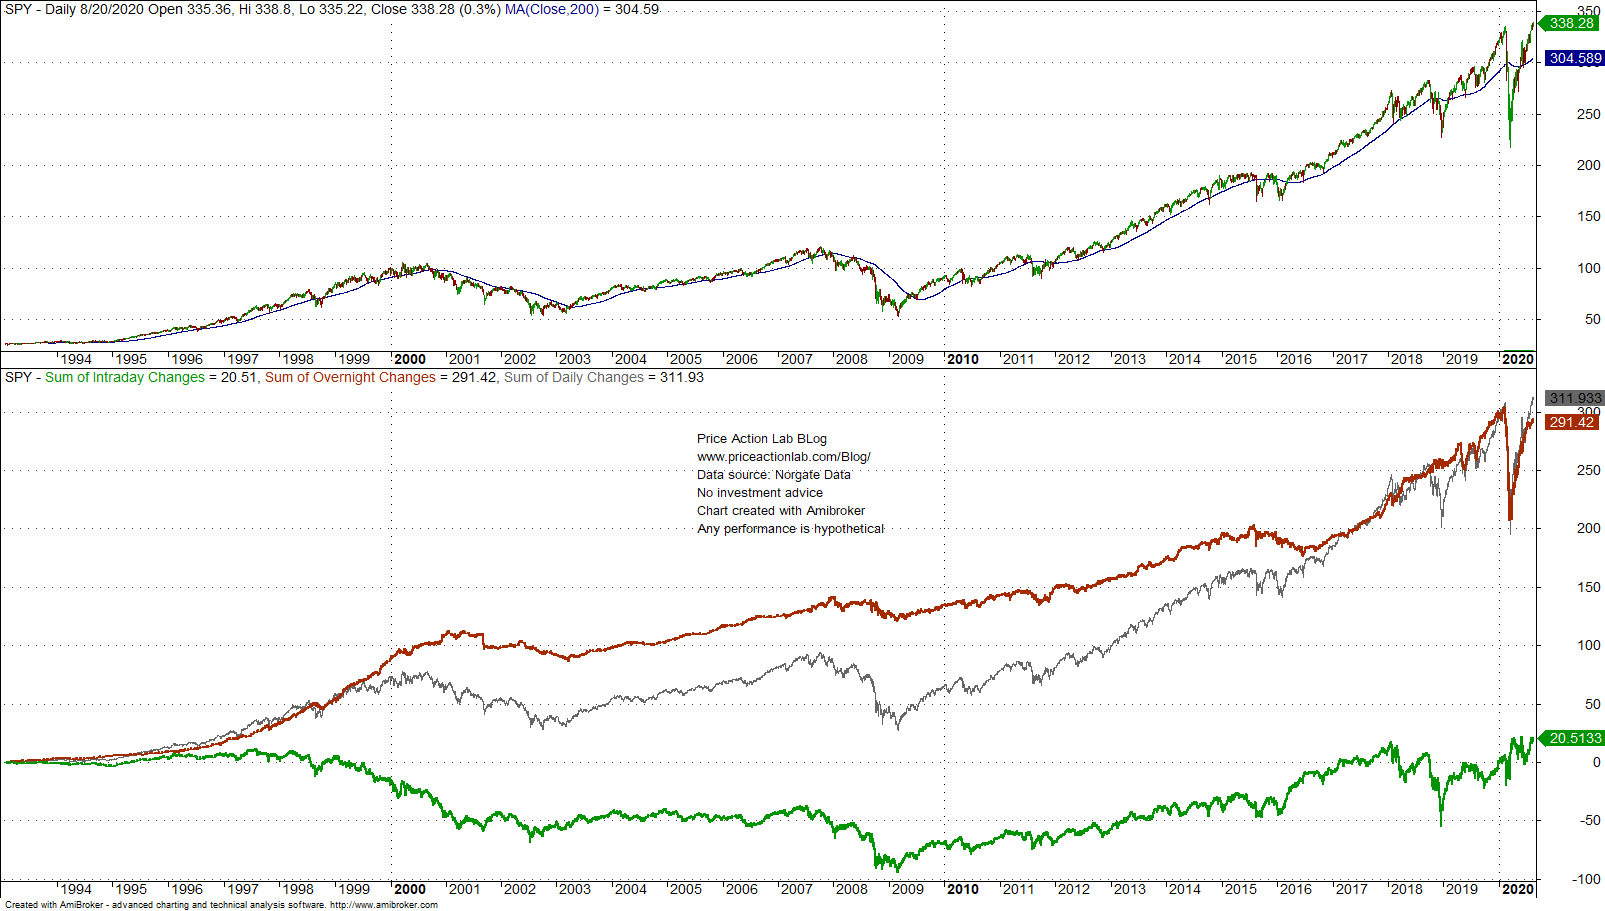
The red line is the overnight accumulation (close to open), the green line is the regular trading hours (RTH) accumulation (open to close) and the gray line is the accumulation of daily changes (close to close).
Let us take a look at the histogram of RTH returns below:

The mean is nearly 0%: trading SPY long or short for daily gains is a process that samples returns from a distribution of zero mean (assuming stationarity.)
Below is the histogram of overnight returns:
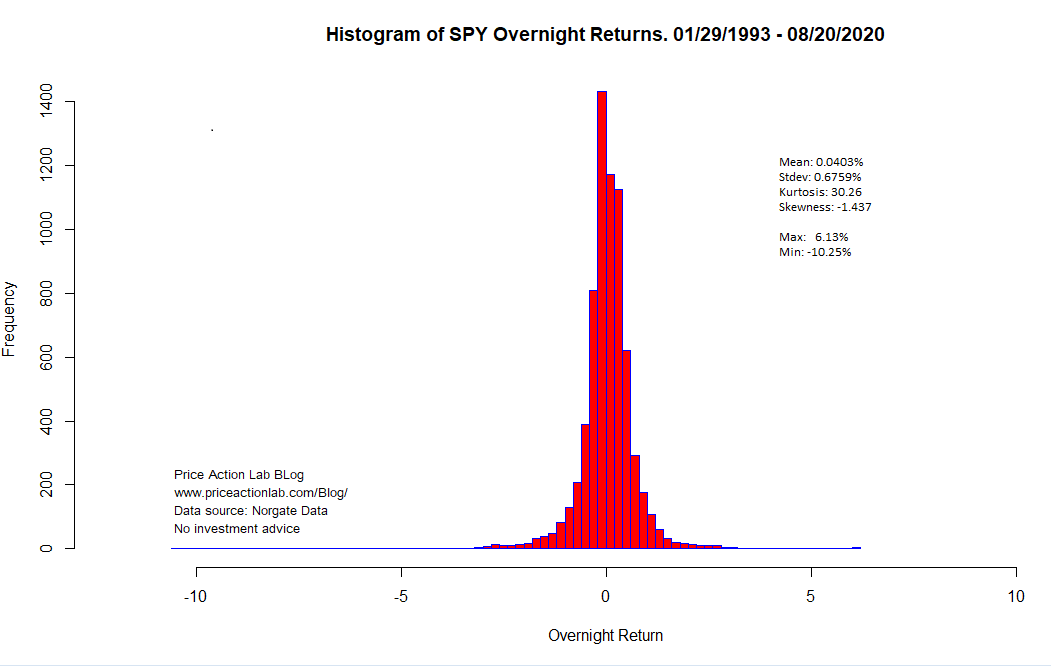
The mean is 0.0403% and has contributed to the bulk of total return from the ETF.
Why is this anomaly present?
Financial markets are too complex for cause and effect analysis. The simplest possible explanation is that this particular market does not deliver profits unless someone is willing to assume overnight risk.
Note that since February 20 of this year when the market crash started, the RTH/overnight relationship reversed. This is shown on the chart below.

By March 19, 2020, the overnight loss since February 20 was about 95 points while RTH performance was flat. After the March bottom overnight started recovering while RTH remained flattish. In the last few days we are seeing again a rise of RTH to its June highs and toppish action in overnight. Why is this happening?
Again, markets are too complex processes to establish any cause and effect. One simple explanation is that market boosting action in terms of verbal and other interventions has occurred mainly during RTH when most traders and investors in U.S. are active. However, this may not be a valid explanation. In fact, an explanation may not even exist.
Charting and backtesting program: Amibroker
Statistical analysis done in R.
Data provider: Norgate Data
If you found this article interesting, you may follow this blog via push notifications, RSS or Email, or in Twitter

Price Action Lab Blog Premium Content


