


In this article we show how train, test and validation steps are used to develop strategies for SPY ETF with DLPAL S.
DLPAL S is used by trading strategy developers who follow systematic signals. The program identifies parameter-less strategies from historical price data that fulfill user-defined performance statistics and risk/reward parameters and generates code for the strategies and systems of strategies for Tradestation (EasyLanguage), Multicharts (EasyLanguage), NinjaTrader (7 and 8) and Amibroker AFL.
Before reading this article we recommend this article on the issues and risks when developing strategies suggested by the data.
We will follow the steps below.
- Spit data in train, test and validation samples.
- Identify strategies in the train sample.
- Select the strategies with positive performance from the test sample.
- Backtest the performance of selected strategies in the validation sample.
Step 1. Spit data train, test and validation samples
We used daily data for SPY ETF and the Data Partition tool in DLPAL S for this stop.
Full history: 01/29/1993 – 04/16/2021
Train sample: 01/29/1993 – 12/31/2012
Test sample: 01/02/2013 – 12/27/2017
Validation sample: 01/02/2018 – 04/16/2021
Step 2. Identify strategies in the train sample
We use the following DLPAL S workspace to identify strategies in the train sample. The parameter settings are as shown below.
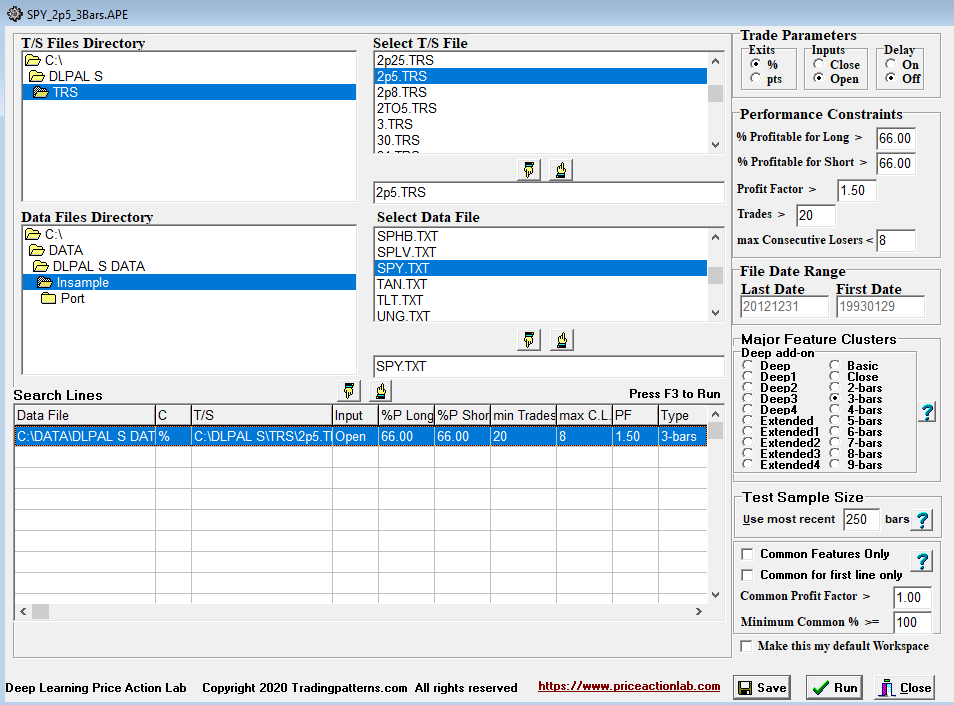
Comments:
- We use the 3-Bar cluster for strategies with 3-bar lookback period.
- We use 2.5% for profit target and stop-loss for all strategies.
- The test sample size for performance evaluation is set to 250 bars.
- We require all strategies to have profit factor greater than 1.5.
- Minimum win rate is 66% and minimum traders are set at 20.
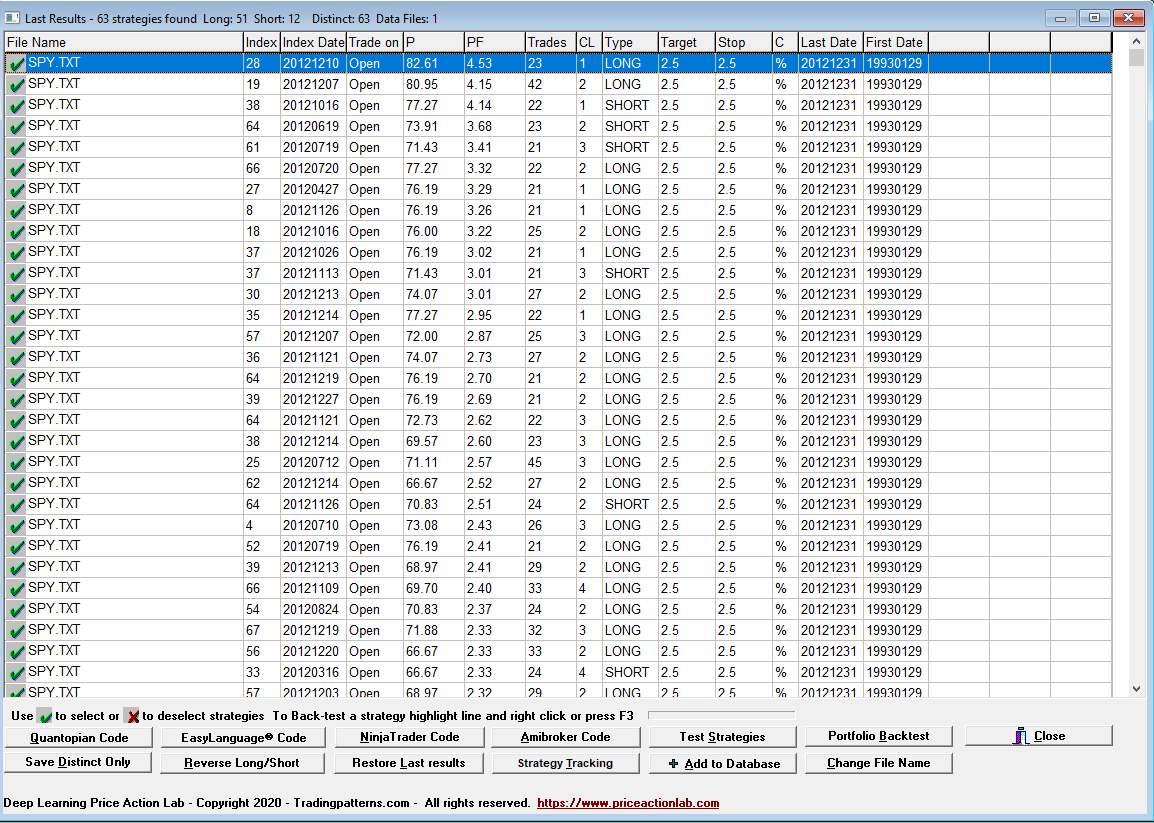
DLPAL S identified 42 long and 11 short strategies that fulfilled the desired performance criteria specified on the workspace.

3. Select the strategies with positive performance from the test sample
Next, we “Test Strategies” in test sample and we sort the results for highest profit factor PF.
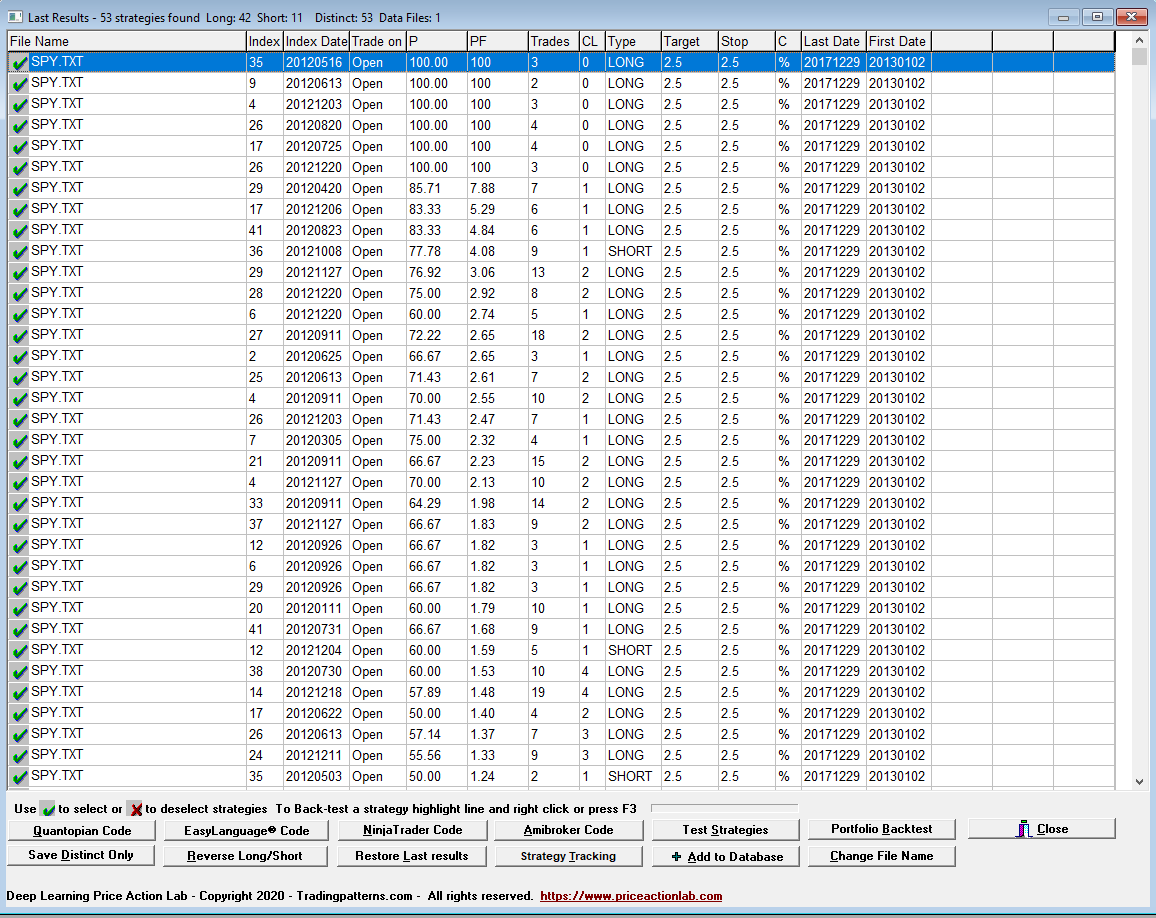
We then click on File Name to deselect all strategies and then select only those with PF > 1, i.e., the strategies with positive performance, and we save the results.
After this step we have introduced bias due to selecting the top performing strategies in the test sample. We will determine if the selection bias resulted in random strategies by testing on the validation sample next.
4. Backtest the performance of selected strategies in the validation sample
For this step we generate Amibroker AFL code for the system of strategies and we backtest the system in that platform only in the validation sample. Below are the results.
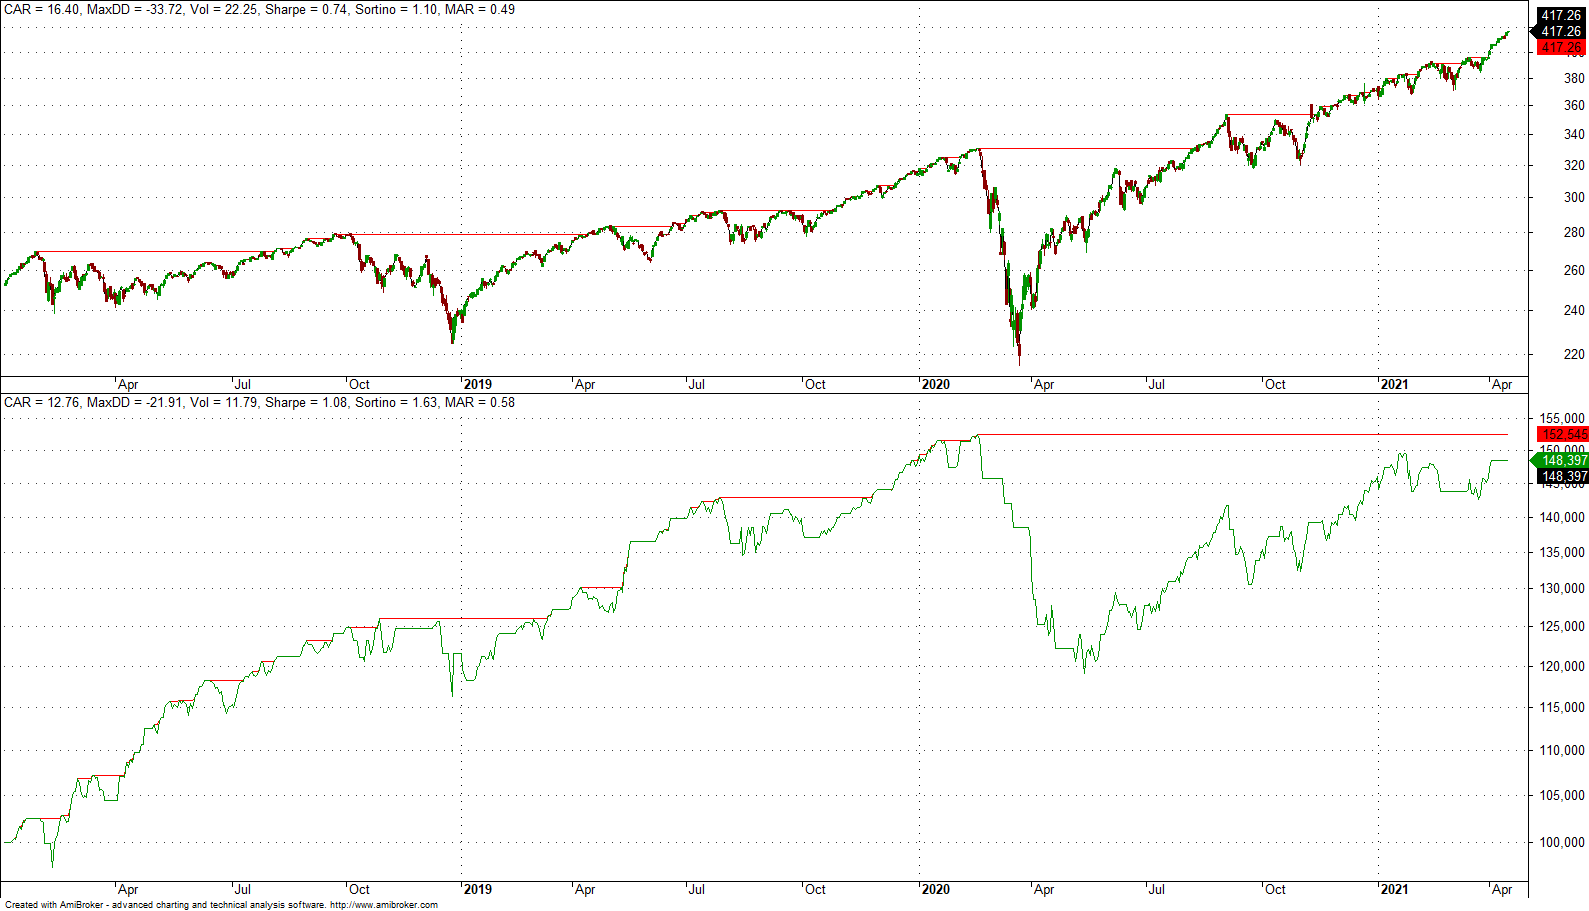
CAR is 12.8% for the strategy versus 16.4% from buy and hold. MDD for the strategy is 22% versus 33.7% for buy and hold. Sharpe for the strategy is slightly above 1 versus 0.74 for buy and hold.
Have we discovered a system to immediately use to make money?
In reality no, this is just analysis and a first step to actually validate the process used to identify the strategies. In addition, we might have been lucky. It takes a lot more work and a mix of several strategies to develop a final system to trade.
Let us repeat the above process with the “Close” cluster.
Step 2. Identify strategies in the train sample
We use the following DLPAL S workspace to identify strategies in the train sample. The parameter settings are as shown below.
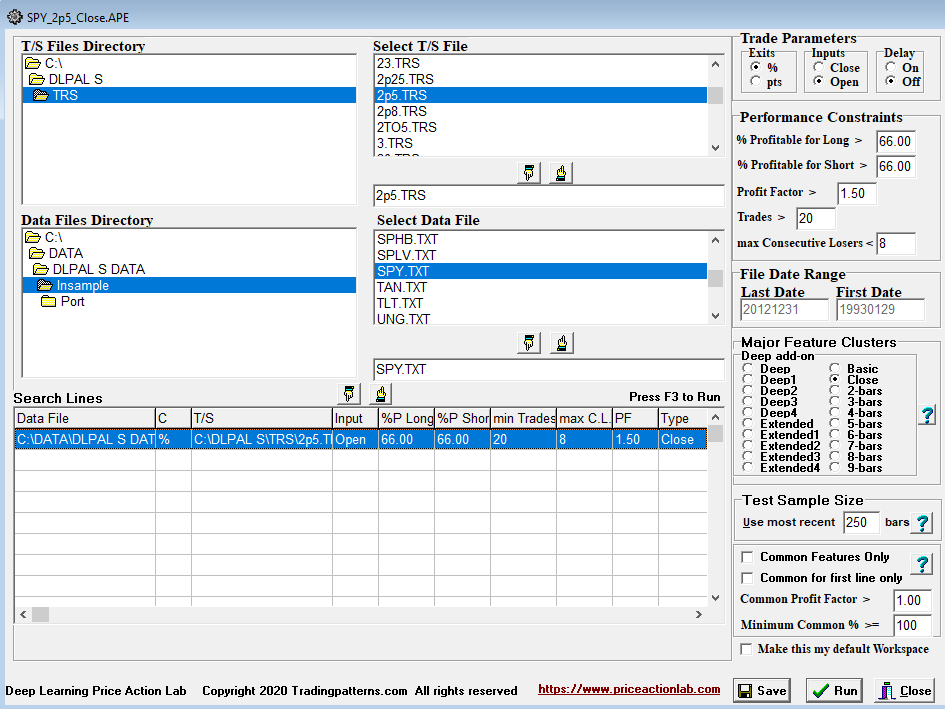
Comments:
- We use the Close cluster for strategies with 3 to 9 bars lookback period,
- We use 2.5% for profit target and stop-loss for all strategies.
- The test sample size for performance evaluation is set to 250 bars.
- We require all strategies to have profit factor greater than 1.5.
- Minimum win rate is 66% and minimum traders are set at 20.
DLPAL S identified 51 long and 12 short strategies that fulfilled the desired performance criteria specified on the workspace.
3. Select the strategies with positive performance from the test sample
Next, we “Test Strategies” in test sample and we sort the results for highest profit factor PF.
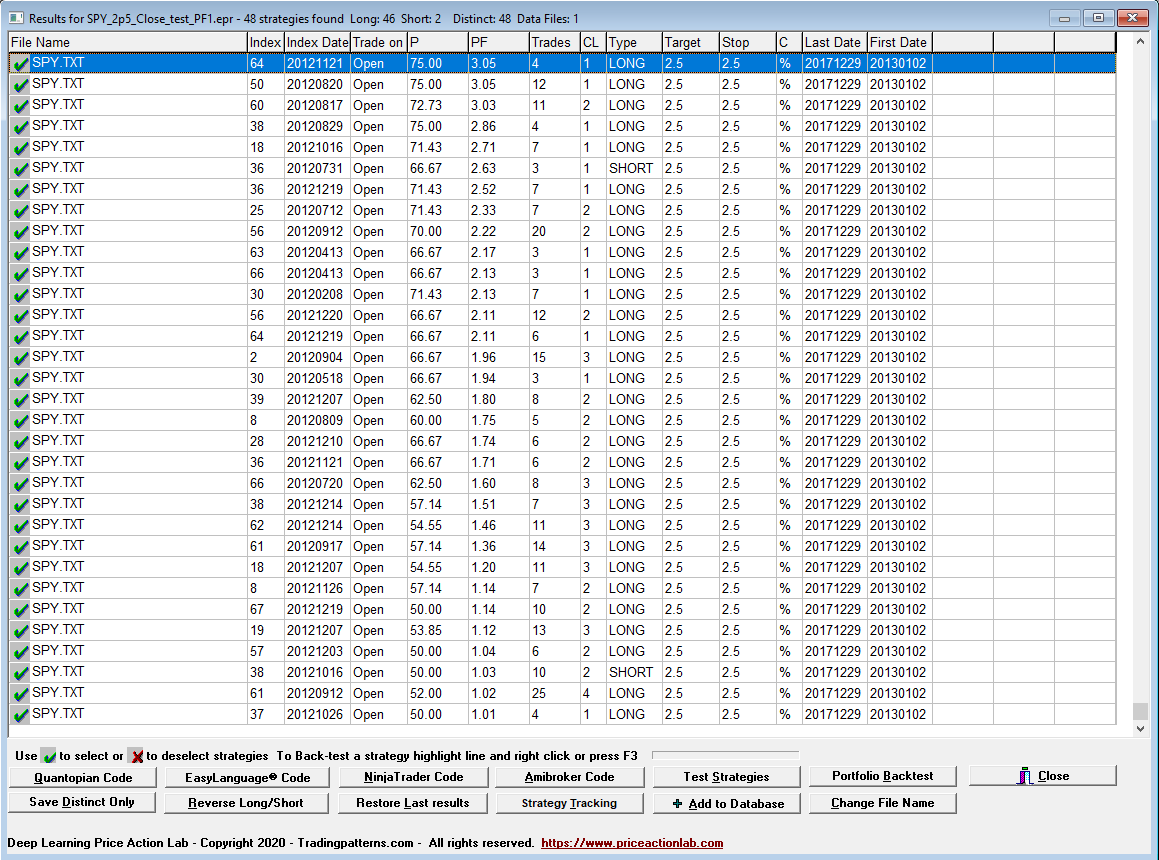
We then click on File Name to deselect all strategies and then select only those with PF > 1, i.e., the strategies with positive performance, and we save the results.
After this step we have introduced bias due to selection of only those strategies that had positive performance. We will determine if the selection bias resulted in random strategies by testing on the validation sample next.
4. Backtest the performance of selected strategies in the validation sample
For this step we generate Amibroker AFL code for the system of strategies and we backtest the system in that platform only in the validation sample. Below are the results.
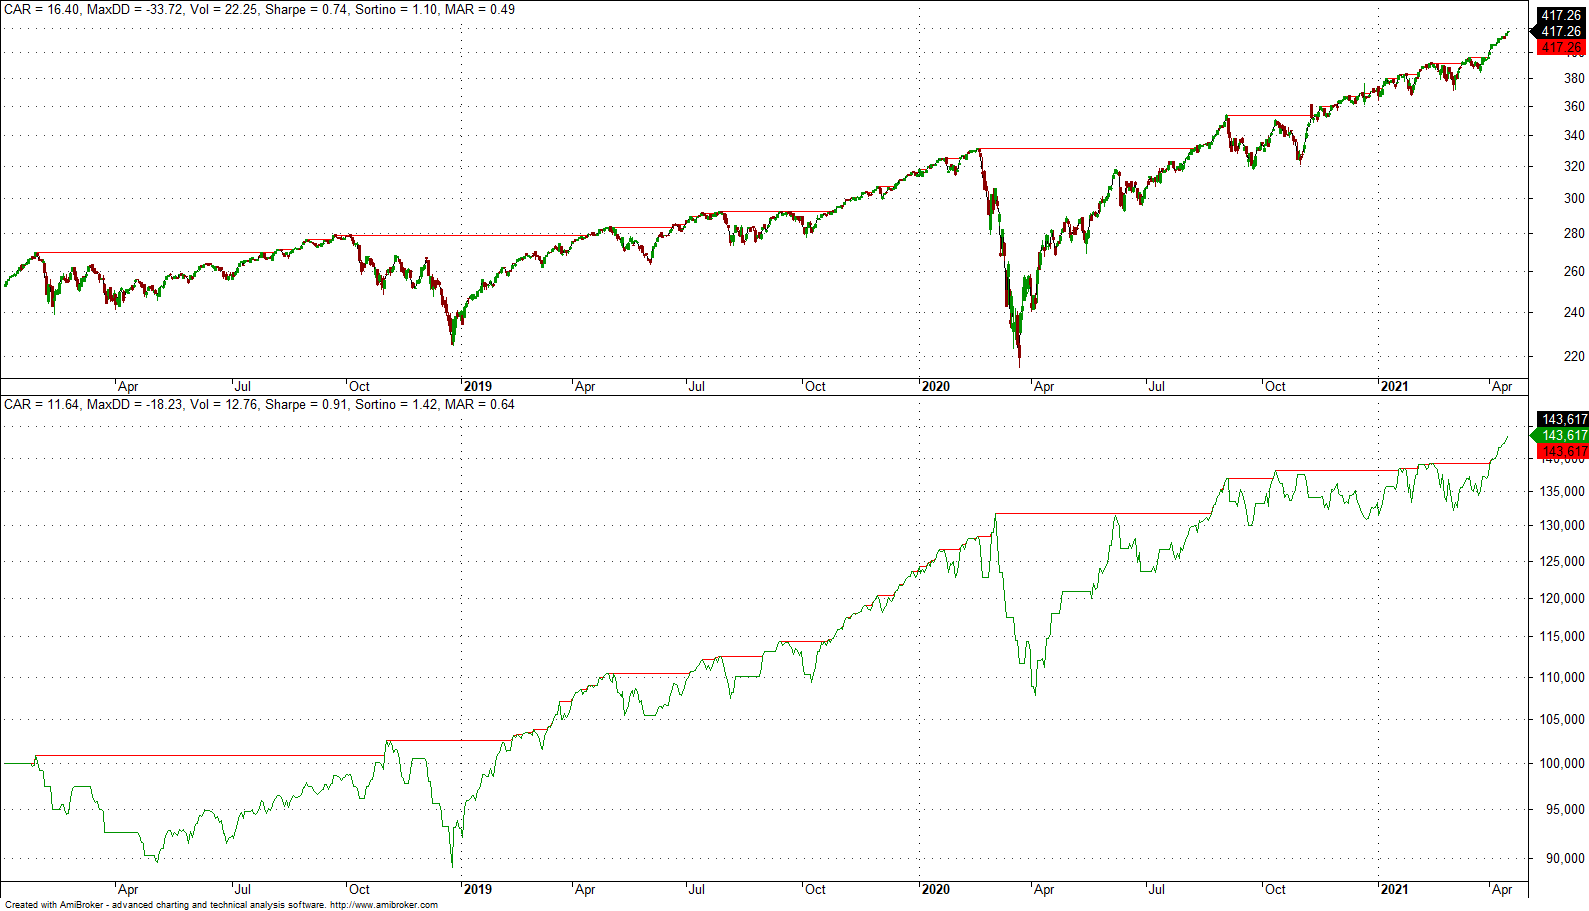
CAR is 11.6% for the strategy versus 16.4% from buy and hold. MDD for the strategy is 18% versus 33.7% for buy and hold. Sharpe for the strategy is 0.90 versus 0.74 for buy and hold. MAR ratio is 0.64 and slightly better than the results from using 3-Bar cluster.
We have now reduced significantly the probability that the first results with 3-Bar cluster were random but we still have a lot of work to do. There is no magic button to develop a final system and anyone who promises that is possibly naïve. Furthermore, developing strategies suggested by the data should not be a primary mode of operation but a side task with the objective of identifying something that can add value to a set of strategies developed by various methods.
Data-mining should not be used as primary source of strategies because the learning curve is steep and usually in the order of 2 – 5 years depending on time spent. With data-mining one is trying to identify strategies to add to a set of already used ones, not as a fundamental process. It is something quants would use as another source of ideas, for example a machine doing the data mining while they are trading. Some quant funds failed because they relied primarily on data mining. In fact, data mined strategy allocation should be small. The objective is to have a few that are uncorrelated to provide some diversification. Click here for more details.
If there was a program to develop a final system that could make money consistently with a mouse click it would sell for tens or even hundreds of thousands of dollars. DLPAL S is an analysis program and this is what we state on our web site:
DLPAL is a quantitative analysis tool. DLPAL will not find strategies that work on all markets especially if the markets are efficient and price action is dominated by noise. DLPAL will not create final systems for autotrading. The user of the software has to put the work necessary for developing a final trading system according to desired criteria and risk/reward objectives. Trading strategy development is a difficult and time-consuming task and success with it is not guaranteed. Read our disclaimer before ordering a license of DLPAL.
This is why it is important for anyone interested to test the free demo first. The demo can do mostly everything except generating code for Amibroker but the basic program backtester can be used instead via the “Test Strategies” option.
More articles about using DLPAL S can be found here.
You can download a free demo of DLPAL S from this link.


