

There is widespread use of the t-statistic in practitioner and academic research of strategies used by the hedge fund industry. Using the t-statistic to quantify the significance of strategies is not only fundamentally problematic but also exposes hedge funds to hidden risks this simple statistical test sweeps under the rug.
I am often surprised to see papers by academics but also practitioners in quantitative finance using the t-statistic in their analysis. In a nutshell, the main problem with strategies used by hedge funds is not so much their historical statistical significance but whether a regime change will cause large drawdown and even termination of operations.
Claiming a strategy worked in the past and pointing to a large t-statistic could be irrelevant to future performance. Even comparing strategies based on t-statistics could be an exercise in futility. The problem with strategies is that they can fail even after performing quite well for decades. In other words, the t-statistic offers a false sense of security, especially when various market regimes are combined to generate a single measure of performance significance.
Below is the performance of a simple long-only price series momentum strategy in S&P 500 from 1941 to end of 1999. Performance is hypothetical and there is no commission included. The strategy goes long when price is above the 11-day moving average and exits when price falls below the average.
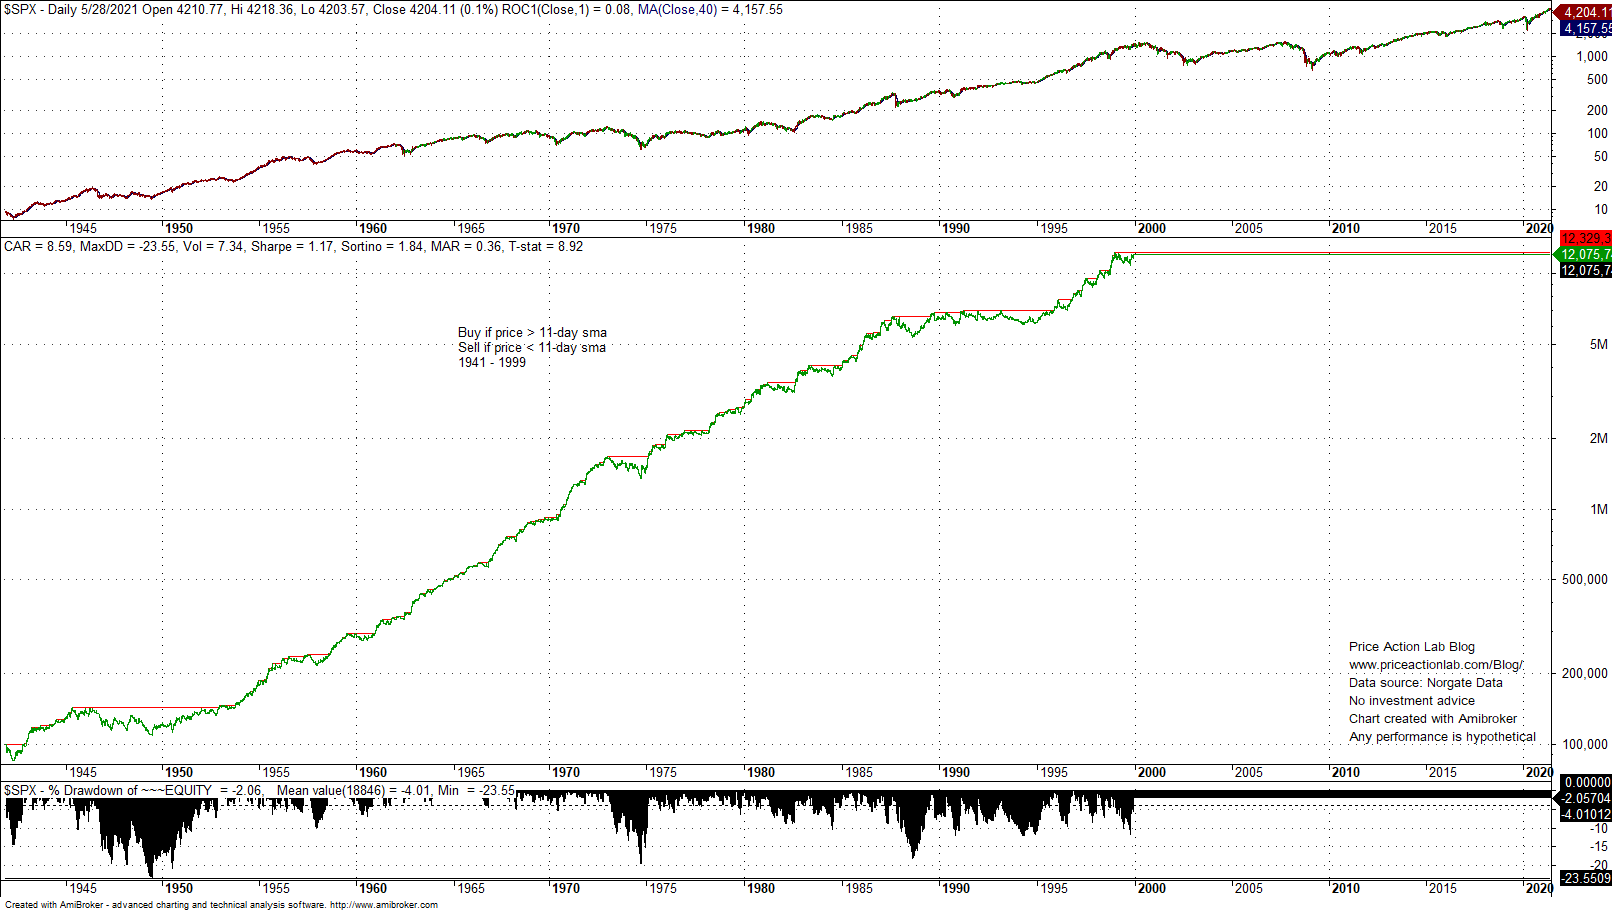
Annualized return is 8.6%, Sharpe is 1.17 and… the t-statistic is 8.9 in the test period. Aspiring quants testing the strategy near the end of 1999 would think they discovered the Holy Grail. But no, the market doesn’t care about the t-statistic and makes its own plans.
Below is the performance of the same strategy from 2000 to 05/28/2021.

The strategy lost more than 50% in the following 8 years and then it took about 20 years to recover the losses thanks to a strong momentum regime after 2018. A 8.9 t-statistic transformed to a 0.17 t-statistic.
The main point from the above example is that it illustrates a significant market regime change after the 90s. It is important for hedge funds to analyze scenarios of regime changes and their impact on returns while avoiding looking at long periods of time where metrics like the t-statistics sweep problems under the rug due to their nature. This is what I mean below.
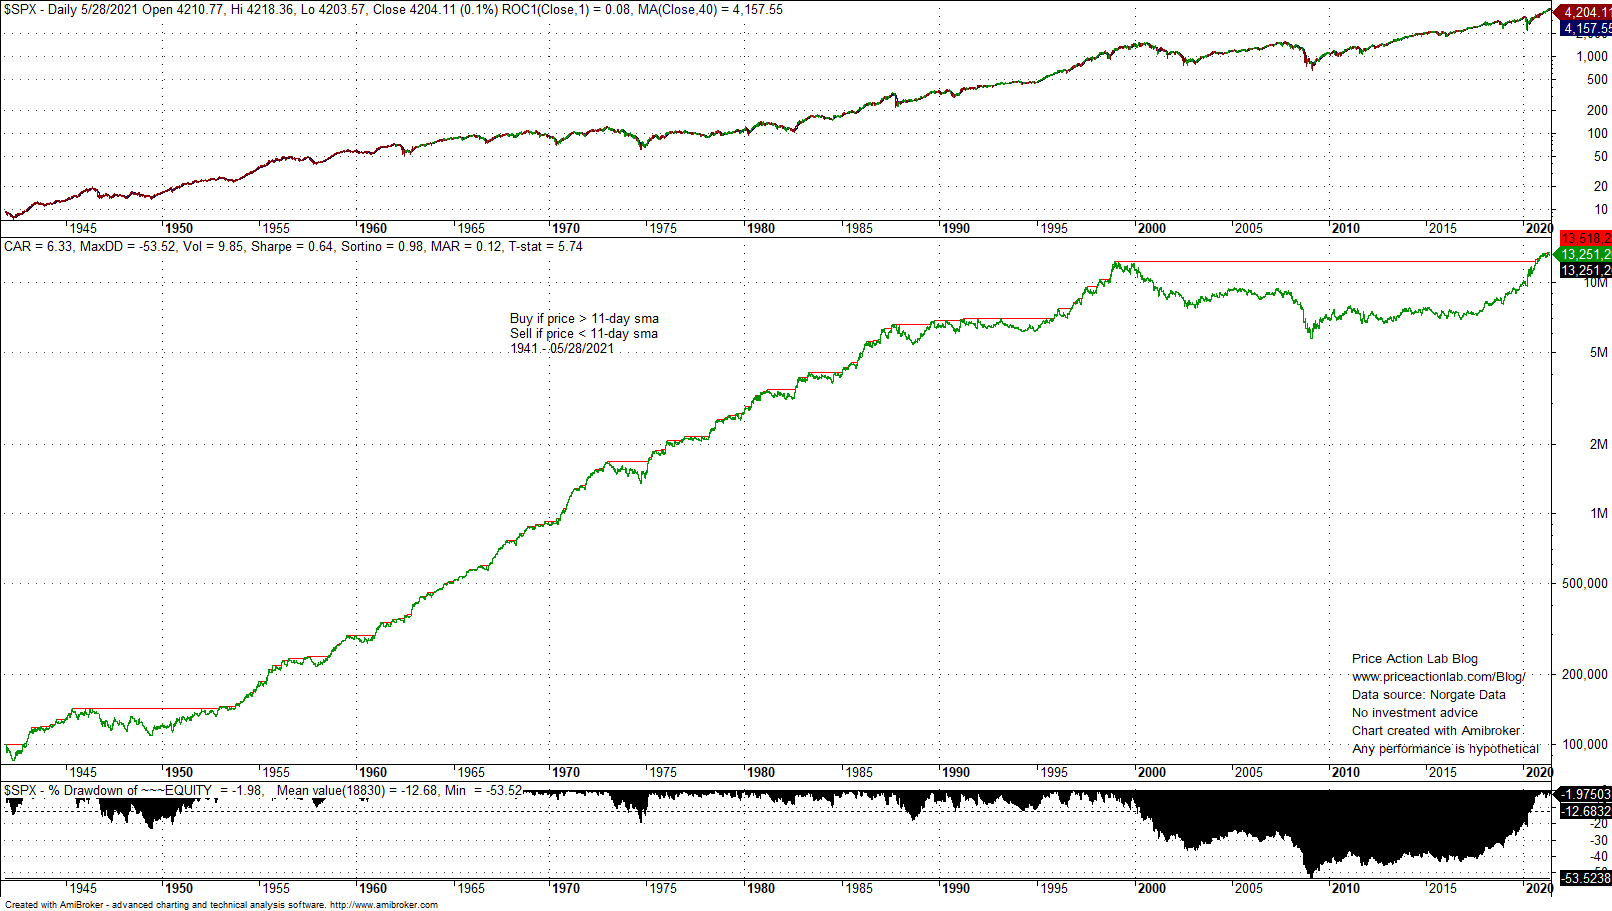
Despite a 53% drawdown and 20-year recovery period, the t-statistic is still 5.74 for this strategy in S&P 500 since 1941. The reason for that is that the t-statistic is given by the formula below:
t-statistic = Sharpe × sqrt(number of years)
Long backtests will generate high t-statistics despite low Sharpe. For example, 100-year backtests yield a t-statistic equal to 10 times Sharpe. Even if Sharpe is 0.3, a significant t-statistic may be obtained. However, that is not useful if there was a 53% drawdown along the way because most funds will close shop after large losses.
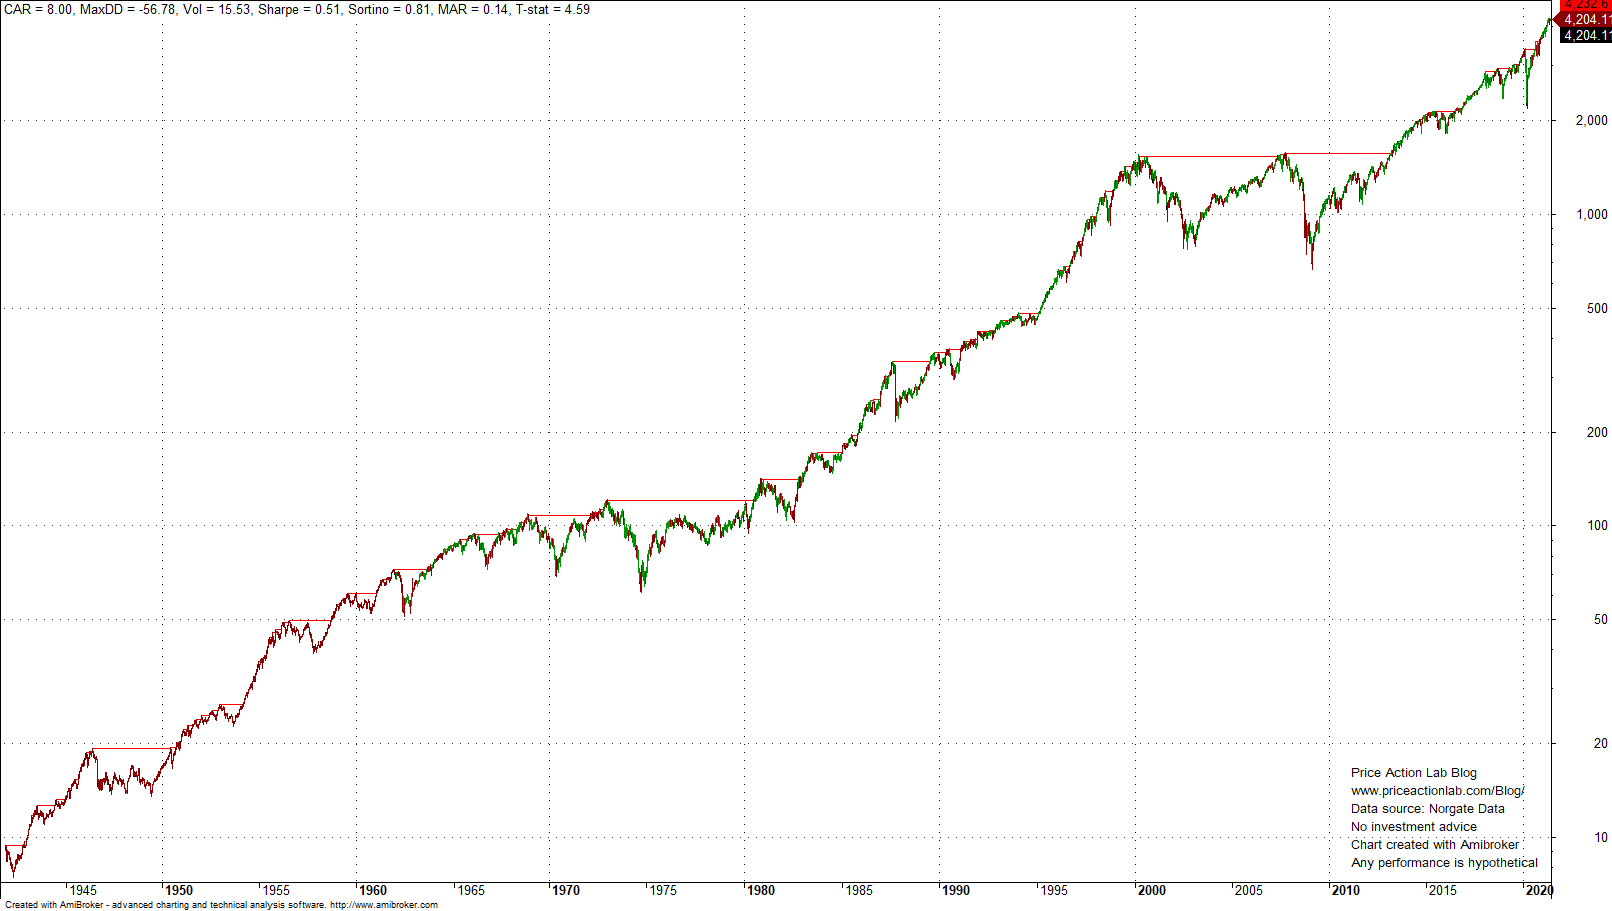
Analyzing the past is easy and the rate of paper creation based on publicly available databases of factors and returns has exploded. However, most of the research is about the past and little is about the future. The assumption that the future will be like the past is more of a wish than anything else. T-statistics involve several assumptions that are violated by market return distributions; they are basically useless numbers as I showed above with a simple example. Instead of resorting to analysis paralysis of the past, fund managers and academics should try to focus on potential risks going forward. A t-statistic of 4 is not really impressive to anyone with skin-in-the-game in market data analysis. In fact, the S&P 500 buy and hold strategy yields a t-statistic of 4.6 with two significant bear markets after 2000 and several large corrections.
More information on the limitations of quantitative claims about strategies and why identifying regime changes is way more important can be found in my paper Limitations of Quantitative Claims About Trading Strategy Evaluation.
Disclaimer: No part of the analysis in this blog constitutes a trade recommendation. The past performance of any trading system or methodology is not necessarily indicative of future results. Read the full disclaimer here.
Charting and backtesting program: Amibroker
Data provider: Norgate Data
If you found this article interesting, you may follow this blog via RSS or Email, or in Twitter

Price Action Lab Blog Premium Content


