


Top 20 Commodity Trading Advisor programs are up 7.3% on the average year-to-date, according to data provided by BarclayHedge. Uncertainty about the convexity of CTA returns is increasing amid rising correlation with stock market returns.
The average top 20 CTA annual performance chart is shown below from Jan 1987 to May 2021 (estimate):
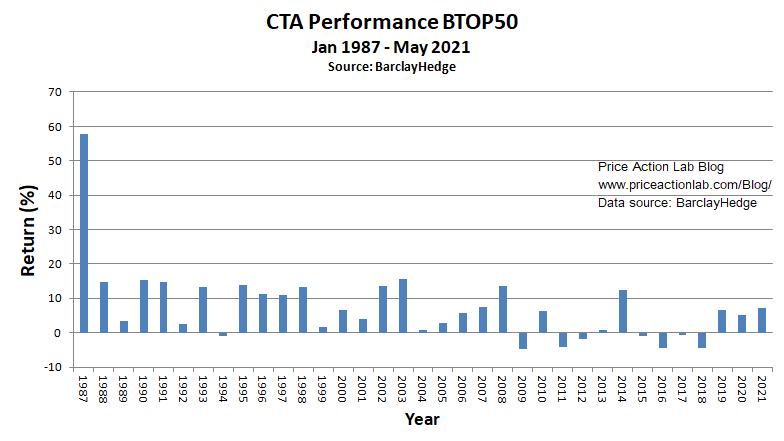
After a four-year losing streak, the top 20 CTAs gained 6.7% on average in 2019, and 5% in 2020 and are up 7.3% this year (Jan – May estimate.) However, since 2004, an annualized return of the top 20 CTAs is about 2.5%. By comparison, S&P 500 annualized return in the same period is 10%.
There may be several causes of CTA underperformance, but the main two are the financialization of commodities and growing competition at lower liquidity. CTAs were forced to diversify even more to deal with lower liquidity and some have increased exposure to equities to boost performance.
The main question of investors who use CTAs as a source of convexity is whether positive performance will be provided in the case of a bear market in equities, as was the case during the dot com and Financial Crisis bear markets. In 2008, the top 20 CTA average return was 13.6% versus a loss of 38.6% for the S&P 500 total return. But then, during 2011, 2015, and 2019, equities fell and CTA performance also fell although we have to make a note that there were no bear markets. Yet, the positive correlation during negative years for equities has increased the uncertainty of these programs providing convexity in the future.
Specifically, although the correlation of CTA and S&P 500 returns since 1987 is nearly 0, after 2012 it is 0.369. This rise in correlation may be problematic but not indicative of what may occur in the next equities bear market.
Below is a chart of the top 20 CTA returns versus S&P 500 total returns since 1988.

Although there has been significant convexity in the past, there are four data points with negative S&P 500 returns that also have negative CTA returns. These may be noise but enough to raise the uncertainty level.
There is still a good probability that CTAs may provide some convexity in case of a bear market in equities and a small allocation may contribute to portfolio diversification. However, a failure to provide convexity may be viewed as a regime change for those programs.
If you found this article interesting, you may follow this blog via RSS , or Email, or Twitter
CTA performance data source: BarclayHedge


