


There is an obsession with uncorrelated returns in finance literature, but they make sense only if they improve total returns. More importantly, correlations in markets are random variables.
Usually, uncorrelated returns improve risk-adjusted performance, but wealth growth depends on total return, not on the Sharpe ratio.
Higher risk-adjusted returns are, in most cases, a choice for risk-averse investors who are willing to trade off total return for lower equity volatility and peace of mind. However, there are often claims of a higher total return through the use of uncorrelated alpha. Most of the claims come from marketing departments. In markets, correlations are dynamic random variables. Usually, when marketing departments refer to correlations, they mean long-term averages. This is where the problem starts with the naïve application of portfolio management.
As an extreme example for the purpose of illustrating the problem, a correlation that stays at +1 for 5 years and then drops to -1 for another five years, has a long-term average of 0. The rolling correlation between the S&P 500 total return (SPY) and managed futures (SG CTA Index) may surprise the reader, although reality is not this extreme.
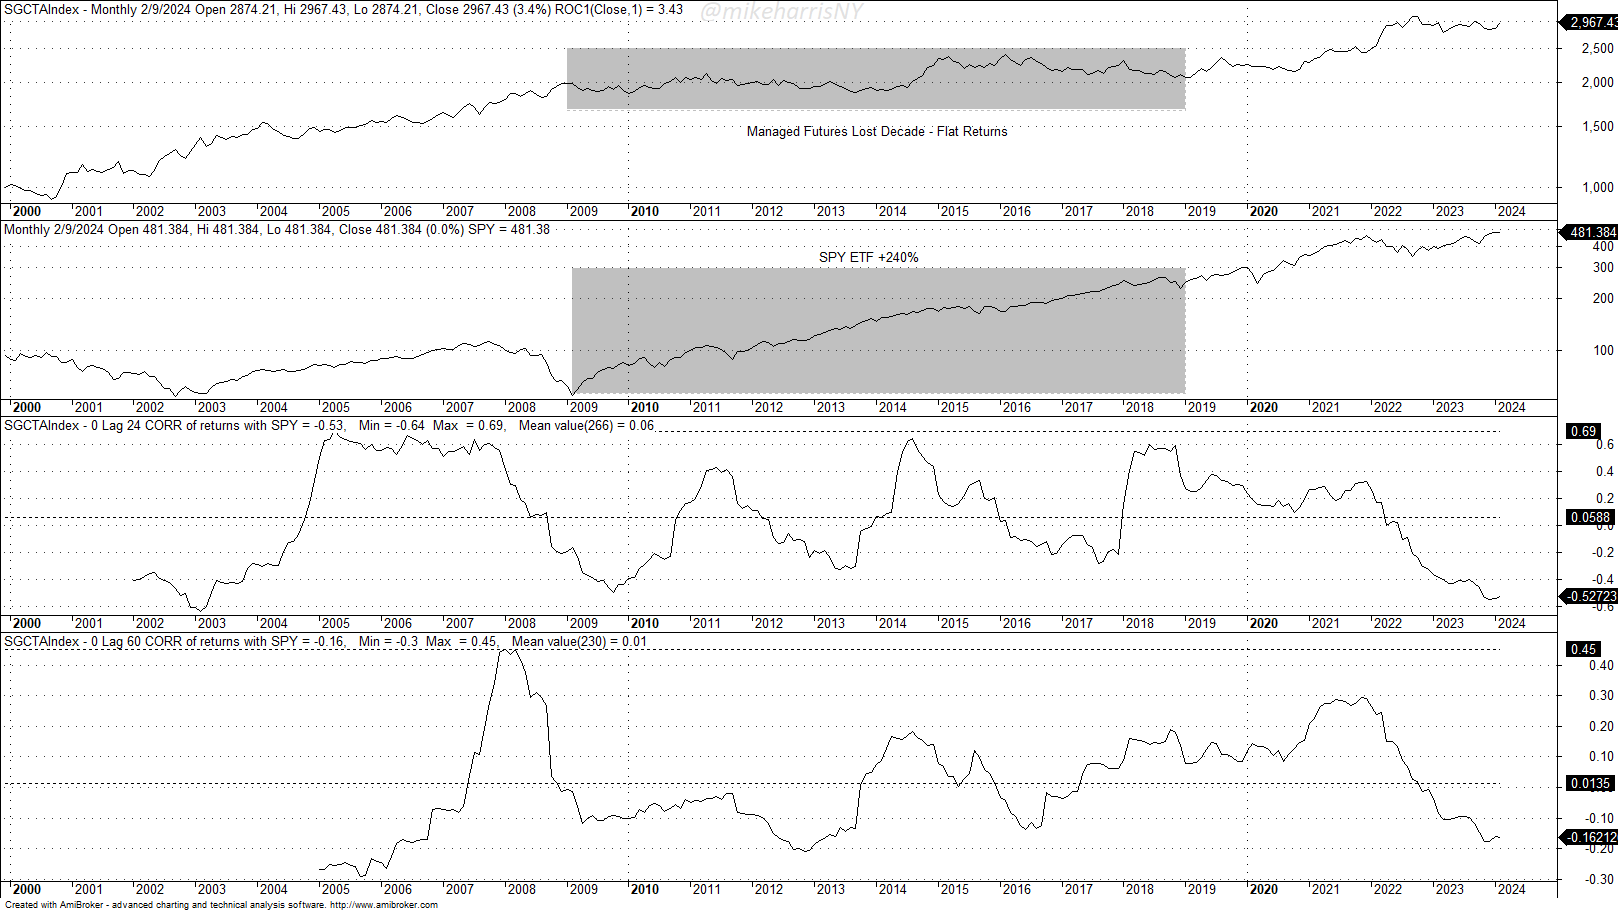
From January 3, 2000, to February 9, 2020, the 24-month correlation has fluctuated between -0.64 and +0.69. The average 24-month correlation is 0.06, or close to zero.
In the same period, the 60-month correlation has fluctuated between -0.30 and +0.45. Again, the average is 0.01 and close to zero.
As with “uncorrelated assets,” which may not be uncorrelated for extended periods of time, “uncorrelated alpha” could also be an artifact of long-term averaging.
Averaging is related to what is called the “ensemble domain.” But investments realize returns in the time-domain. The above chart shows the “lost decade” in managed futures from 2009 to 2018 with a flat return. In the same period, the SPY ETF gained 240%. Investors and allocators in managed futures, due to low or zero correlation in the long term, showed a significant negative impact on their portfolios due to the “lost decade.” In addition, even during the lost decade, there were wide swings in the correlation between stocks and managed futures.
Usually, uncorrelated alpha turns out to be leveraged beta. We cannot discount the possibility that pure uncorrelated alpha exists, but it is highly unlikely due to the random nature of correlation. After marketing pitches, investors may get the impression that the so-called “uncorrelated alpha” will offer a higher total return at lower volatility. Although possible, it is highly likely they are investing in leverage beta with periods of higher correlation to equities.
There is nothing wrong with leverage beta as long as it does not cause an uncle point. In fact, a correlation to equities may not only be beneficial but also required in these markets. I posted on X the following backtest of a 2x leveraged long-only strategy based on the 12-month moving average, and I believe it caught some people by surprise.
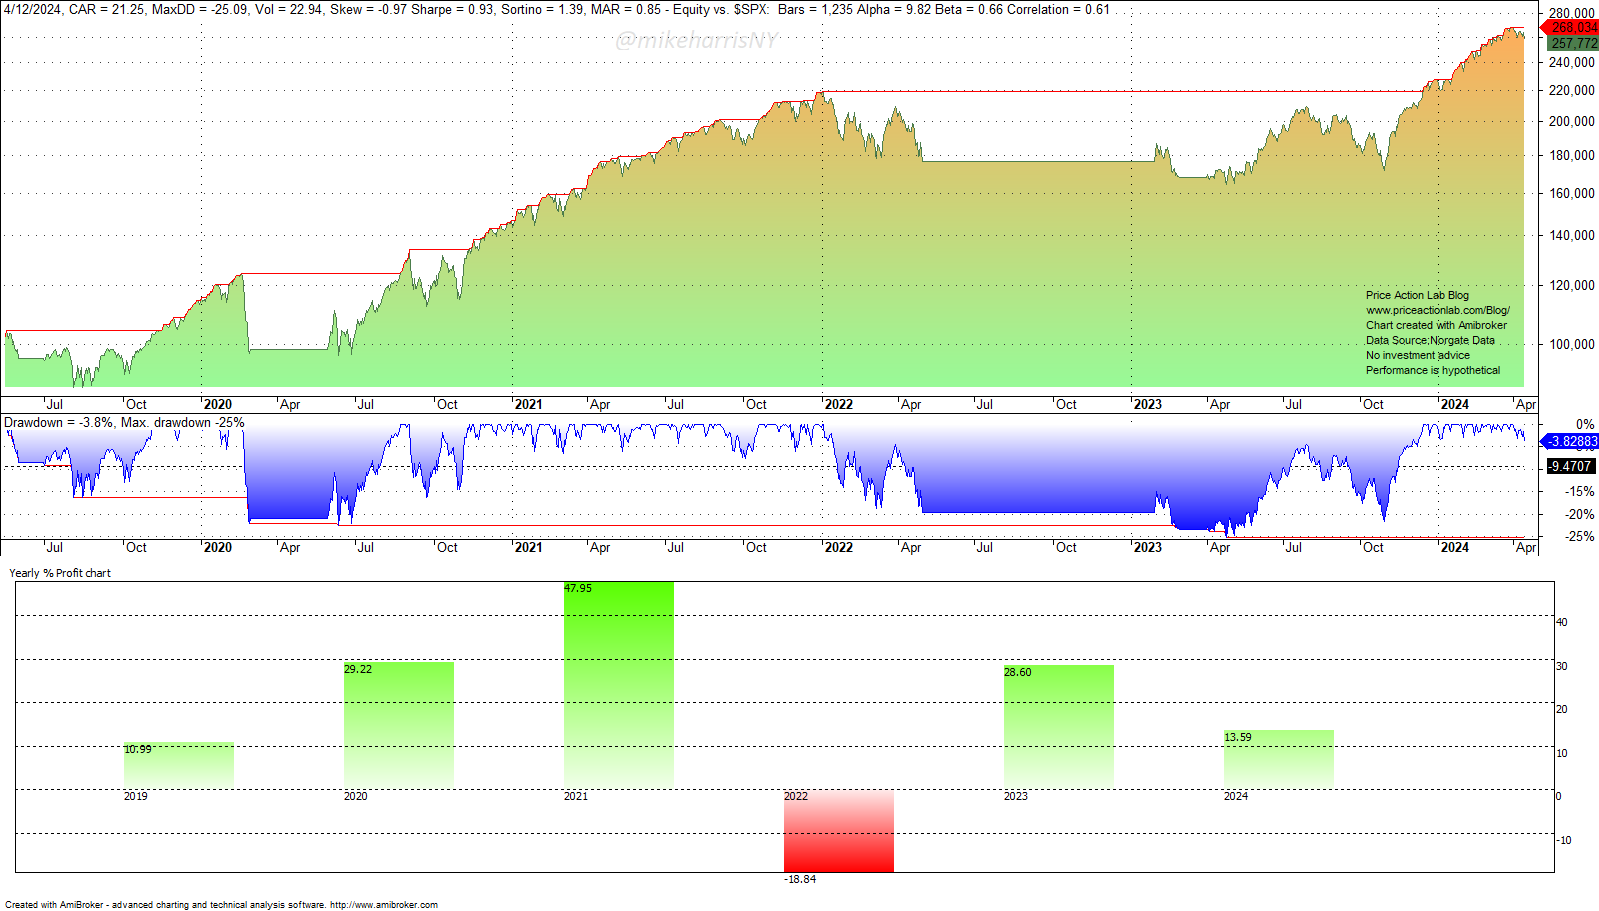
Since mid-2019, the annualized return has been 21.2%, and the Sharpe is 0.91, close to 1. The equity stayed underwater for about two years but recently reached new all-time highs. Below is the backtest from the inception of the SPY ETF.
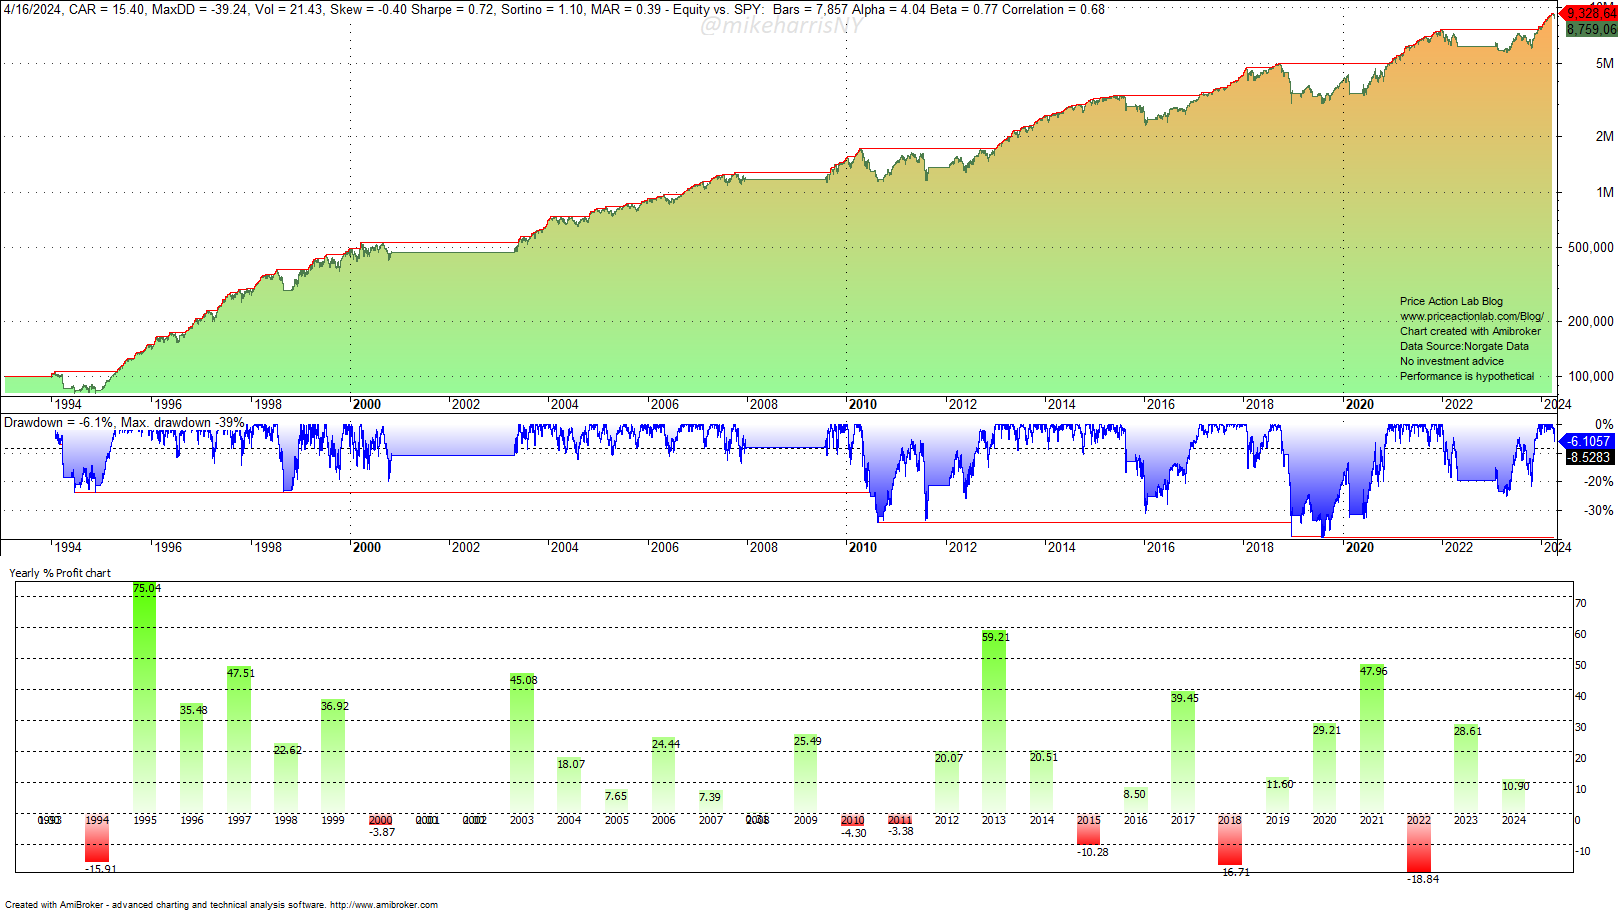
The annualized return is 15.4%, Sharpe is 0.72, and the alpha is 4%. The correlation of this strategy with the SPY ETF is 0.68. This is leveraged beta, but should investors care if alpha is about 4%? After all, investors cannot spend “uncorrelated alpha,” but only total return.
Summary
Claims of uncorrelated alpha could be artifacts of random correlation and hidden leverage. Investors should carefully scrutinize such claims. Although uncorrelated alpha is possible, it is highly unlikely in dynamic, non-stationary markets.
Premium Content
You have immediate access to hundreds of articles when you subscribe. Premium Articles subscribers have immediate access to more than two hundred articles, while All in One subscribers have access to all premium articles, books, premium insights, and market signal content.
Specific disclaimer: This report includes charts that may reference price levels determined by technical and/or quantitative analysis. If market conditions change the price levels or any analysis based on them, we will not update any charts. All charts in this report are for informational purposes only. See the disclaimer for more information.
Disclaimer: No part of the analysis in this blog constitutes a trade recommendation. The past performance of any trading system or methodology is not necessarily indicative of future results. Read the full disclaimer here.
Charting and backtesting program: Amibroker. Data provider: Norgate Data
If you found this article interesting, you may follow this blog via RSS, Email, or Twitter.


