


What is the optimal allocation to managed futures? The short answer is that any allocation can be optimal or not, because the future is unknown. Please do not read this article if you believe you can easily determine an optimal allocation.
The “optimal allocation” depends on the objective function and any constraints. In most cases, if you see the words “optimal” (an adjective) or “optimum” (a noun) in reference to markets, trading, investing, and portfolio allocation, there are many assumptions, implicit or explicit. In ninety percent of the cases, the main assumption is that it is possible to calculate a magical number using historical analysis that will make sense going forward. This is because the “optimum” depends on market regimes, and identifying those is a much harder problem than calculating optimal values.
I keep inserting “optimal” in quotes. I do this because what is an “optimal allocation” to any group of assets depends on the objective function of the investors. There are many possible objective functions. Even worse, investors keep changing their objective functions “on the fly.” When the going gets tough, investors wish they had maximized risk-adjusted returns. When conditions are favorable for equities, investors pay attention to total returns. Specifically, after a large drawdown in equities and a rally in managed futures, as in 2022, when the S&P 500 total return ended down 18.2% but the SG CTA gained a stunning 20.1%, investors wish they had maximized the Sharpe ratio of their portfolio allocation. And some did that post-hoc by allocating heavily to managed futures. But in 2023, with stocks up 26.2% and the SG CTA index down 3.5%, investors regretted increasing their allocation to managed futures because of a lower total return. There is no way to calculate the “optimal allocation” when the objectives change constantly. More importantly, even if the objectives are clear ex-ante, non-stationarity and path-dependency can render the allocation suboptimal. Is there a way to deal with this problem? What is the optimal allocation to managed futures in an uncertain environment?
At the highest level, when considering optimal allocations, there are two main suggestions:
- The objective function will remain the same.
- The future will be similar to the past.
1. If the objective changes on the fly due to market conditions, it makes no sense to talk about optimal allocations. A “naïve” solution may be the best choice, for example, 50% stocks, 30% bonds, and 20% managed futures. With this allocation, an investor relies on luck. This does not mean that relying on luck is worse than deciding based on fancy quantitative analysis. In finance, it is often hard to differentiate between quantitative analysis and sophisticated marketing.
2. If the future is not going to be similar to the past, at least in the sense of wide-sense stationarity (mean and correlation function do not change by shifts in time, and the variance is finite), then it makes no sense to talk about optimal allocations; we must revert to an ad-hoc portfolio and rely on luck. This is basically what a 60/40 allocation to stocks and bonds is, but luck was not on its side in 2022. Incidentally, when financial advisers put the money of clients in a 60–40 portfolio, they essentially argue they rely on luck, and maybe for a good reason: they do not know whether the future will be similar to the past, and they also have no idea how the objective function of the client will change.
After this brief introduction to a complicated subject, let us try to answer the question: What is the optimal allocation to managed futures?
We will assume that the two conditions above are true, namely, stable objectives and wide-sense stationarity. We also consider two objective functions for the purpose of this brief article: Maximize the total return and maximize the risk-adjusted returns. Before providing any probable answers, let us look at some data for the S&P 500 total return and the SG CTA index from 2000 to 2023.
| SPY ETF | SG CTA Index | |
| Mean annual return | 8.6% | 4.70% |
| Annualized volatility | 18.3% | 7.22% |
Case 1: The objective function is to maximize the total return.
For a portfolio of stocks, the optimal allocation is 0%.
Case 2: The objective function is to maximize the risk-adjusted return.
If we assume that the future will be similar to the past, things get quite interesting. But we have to introduce another explicit requirement: the long-term correlation between managed futures and stocks will remain close to zero (note that in the short term, this correlation is quite volatile). This is a reasonable assumption, since we already assume wide-sense stationarity.
Below is the Sharpe ratio plot (Rf=0) when varying the allocation to stocks from 0 to 1.
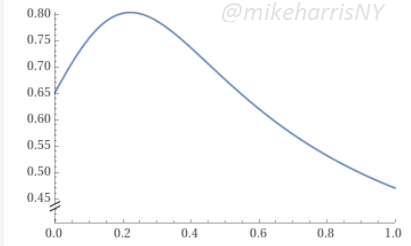
Based on our inputs, WolframAlpha generated a result
A 25% allocation to stocks results in a maximum Sharpe value of around 0.80. A backtest of this passive allocation (no annual rebalancing) is shown below.
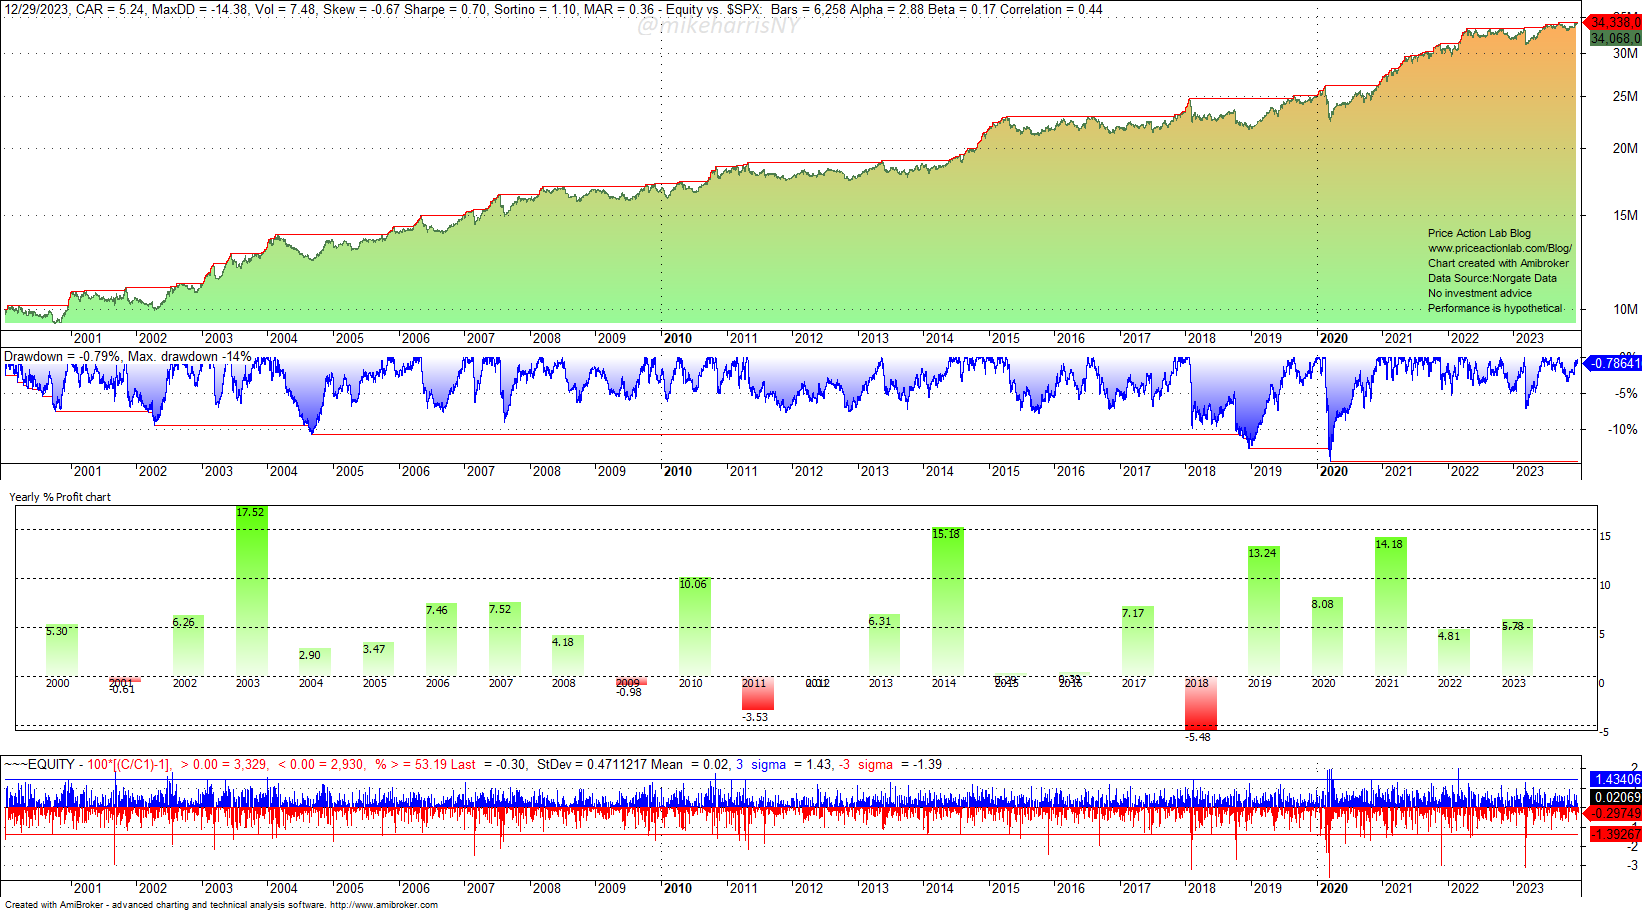
The Sharpe ratio is 0.70, close to the theoretical value. The mean yearly return is 5.4%, close to the theoretical 5.5%. Despite being 180 basis points less than a 100% passive allocation to stocks (7%), the annualized return of 5.2% represents the high cost of reducing volatility from 18.3% to 7.5%.
Time to talk about Monte Carlo
Every reasonable article on investing should include Monte Carlo analysis, even when the numerous conditions that make it valid are not stated and will not be stated here as well. In essence, Monte Carlo, like the majority of financial analysis, is a form of alchemy. But at least it helps us keep things in perspective.
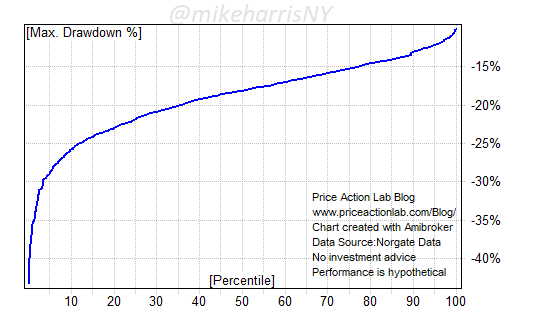
A Monte Carlo simulation based on equity curve changes reveals that there is a 10% probability that the maximum drawdown will not be 14.4% but higher than 25%. There is a 5% probability that the maximum drawdown will be higher than 30%. This means that even with risk-adjusted return maximization, there are relatively high odds of large losses.
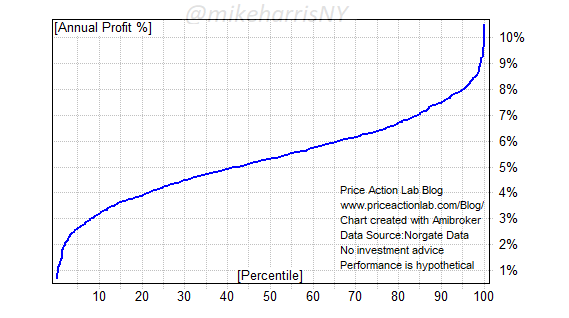
In addition, a 25%–75% allocation to stocks and managed futures has a 10% probability of yielding a CAGR of less than 3% and a 5% probability of yielding a CAGR of more than 8%. There is also a small probability that CAGR will drop below 1%. The backtest above was based on one realized historical path, but future paths could be different, even if the process is wide-sense stationary.
Conclusion
For equity investors who do not care much about drawdowns, expect equities to deliver similar returns as in the past going forward, and the focus is on maximizing portfolio growth, then there is probably no need for an allocation to managed futures.
For risk-averse investors, who will not regret sacrificing total return in exchange for lower volatility, the optimal allocation to managed futures that could maximize the Sharpe ratio is around 75%, assuming there are no major regime changes and managed futures remain uncorrelated to equities in the long term. These could be unrealistic assumptions.
If you do not agree with the conclusions of this article, it is probably because your assumptions and your analysis are different, i.e., you are doing a different kind of alchemy, less or more advanced, but still alchemy.
Premium Content
You have immediate access to hundreds of articles when you subscribe. Premium Articles subscribers have immediate access to more than two hundred articles, and All in One subscribers have access to all premium articles, books, premium insights, and market signal content.
Specific disclaimer: This report includes charts that may reference price levels determined by technical and/or quantitative analysis. If market conditions change the price levels or any analysis based on them, we will not update any charts. All charts in this report are for informational purposes only. See the disclaimer for more information.
Disclaimer: No part of the analysis in this blog constitutes a trade recommendation. The past performance of any trading system or methodology is not necessarily indicative of future results. Read the full disclaimer here.
Charting and backtesting program: Amibroker. Data provider: Norgate Data
If you found this article interesting, you may follow this blog via RSS, Email, or Twitter.


