


On Friday, June 25, 2021, Nike surged to all-time highs on massive earnings beat. Last time Nike surged more than 15.5% was two days after the 1987 crash. This right tail event is a wake up call for bears.
The chart below shows up, down and combined daily returns of Nike since IPO.
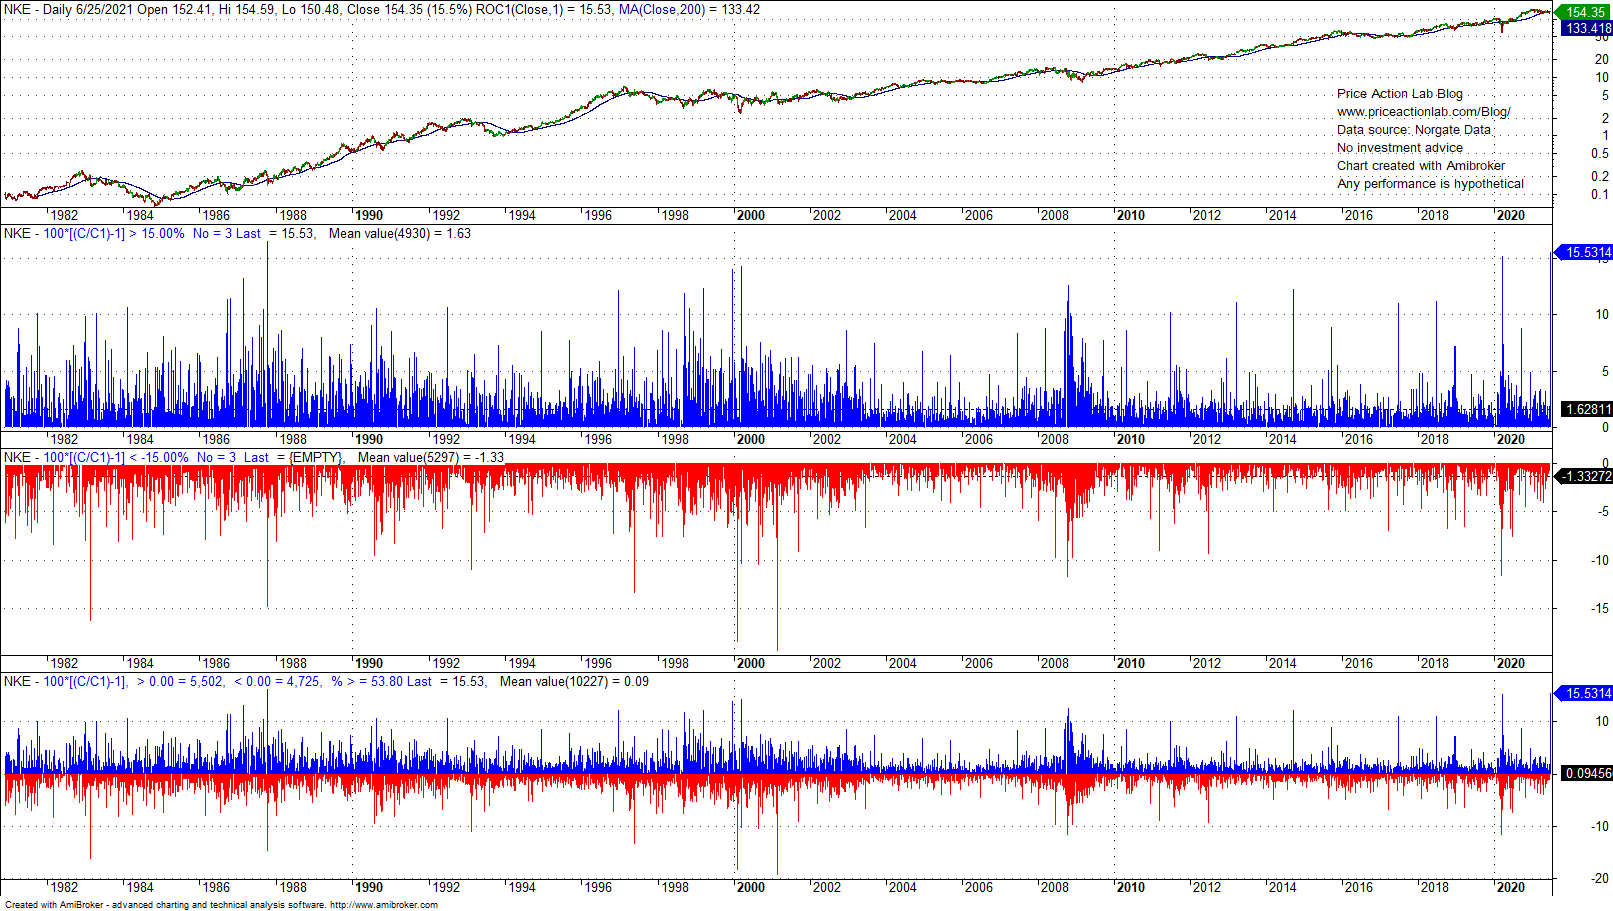
There have been three tail events with daily gain of more than 15% and also three left tail events with loss of more than 15%.
Last time Nike rose more than 15.5% from close to close was two days after the October 1987 crash; on October 21, 1987, Nike surged 16.67%.
The surge in Nike stock should is a wake up call for bears and especially those who use dual-axis charts of economic indicators and those who divide prices by the Fed balance sheet.
The stock market penalizes simplistic bear analysis. It’s highly complex non-linear stochastic system with many inputs but the output is only price and its direction. Using some, or even only two, of the inputs to determine direction is an exercise in futility. Technical analysts decided long ago that the only way to forecast direction is by looking at price only. Although this method has many problems too, it’s way better than looking at a few inputs and especially lagging ones such as macroeconomic variables.
As I have argued in another article, there is no bubble in the stock market. Most of those who think there is a bubble look at price levels and not returns. Price levels are mostly irrelevant because what determines price constantly changes. One must look at returns and even that can be misleading. The chart below shows 1000-day rolling returns (about four years) of S&P 500.
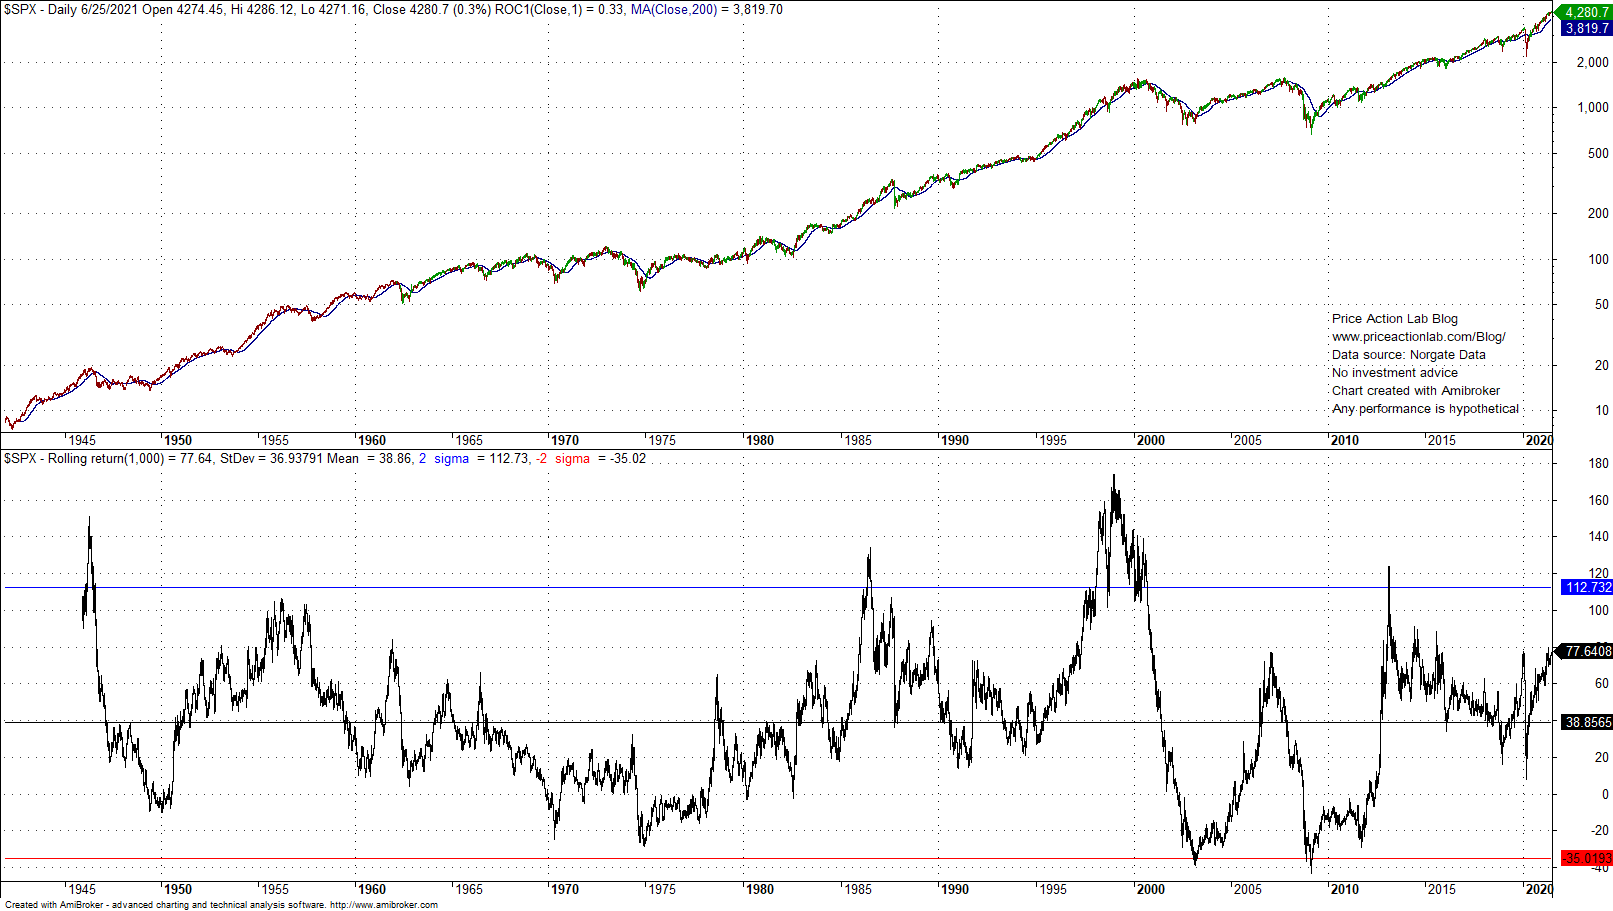
The 1000-day rolling return is at 77.5% and that is much below two standard deviations of the available sample and about half of the level realized near the dot com top. If the 1000-day return rises above 120%, then it may become an over-extended market. But that level is about 25% higher from current S&P 500 levels.
Disclaimer: No part of the analysis in this blog constitutes a trade recommendation. The past performance of any trading system or methodology is not necessarily indicative of future results. Read the full disclaimer here.
Charting and backtesting program: Amibroker. Data provider: Norgate Data
If you found this article interesting, you may follow this blog via RSS or Email, or in Twitter
Offer: 25% off with coupon code DC25. Expires Wednesday, June 30, 2021.

Price Action Lab Blog Premium Content


