


Growth in multiplicative processes starts slowly but after a point quickly accelerates exponentially and may offer the impression of a bubble but that is not the case necessarily. This phenomenon manifests itself in markets and if the right observable is not used, wrong conclusions can be made.
I will try to explain the main point of this article without any math. People not familiar with market dynamics and specifically growth processes, may look at charts of some stocks, or the S&P 500, and think these are bubbles since prices appear to grow exponentially.
For example, when looking at a long-term chart of S&P 500, some people think that because prices rose fast after 2010, this must be a bubble market.
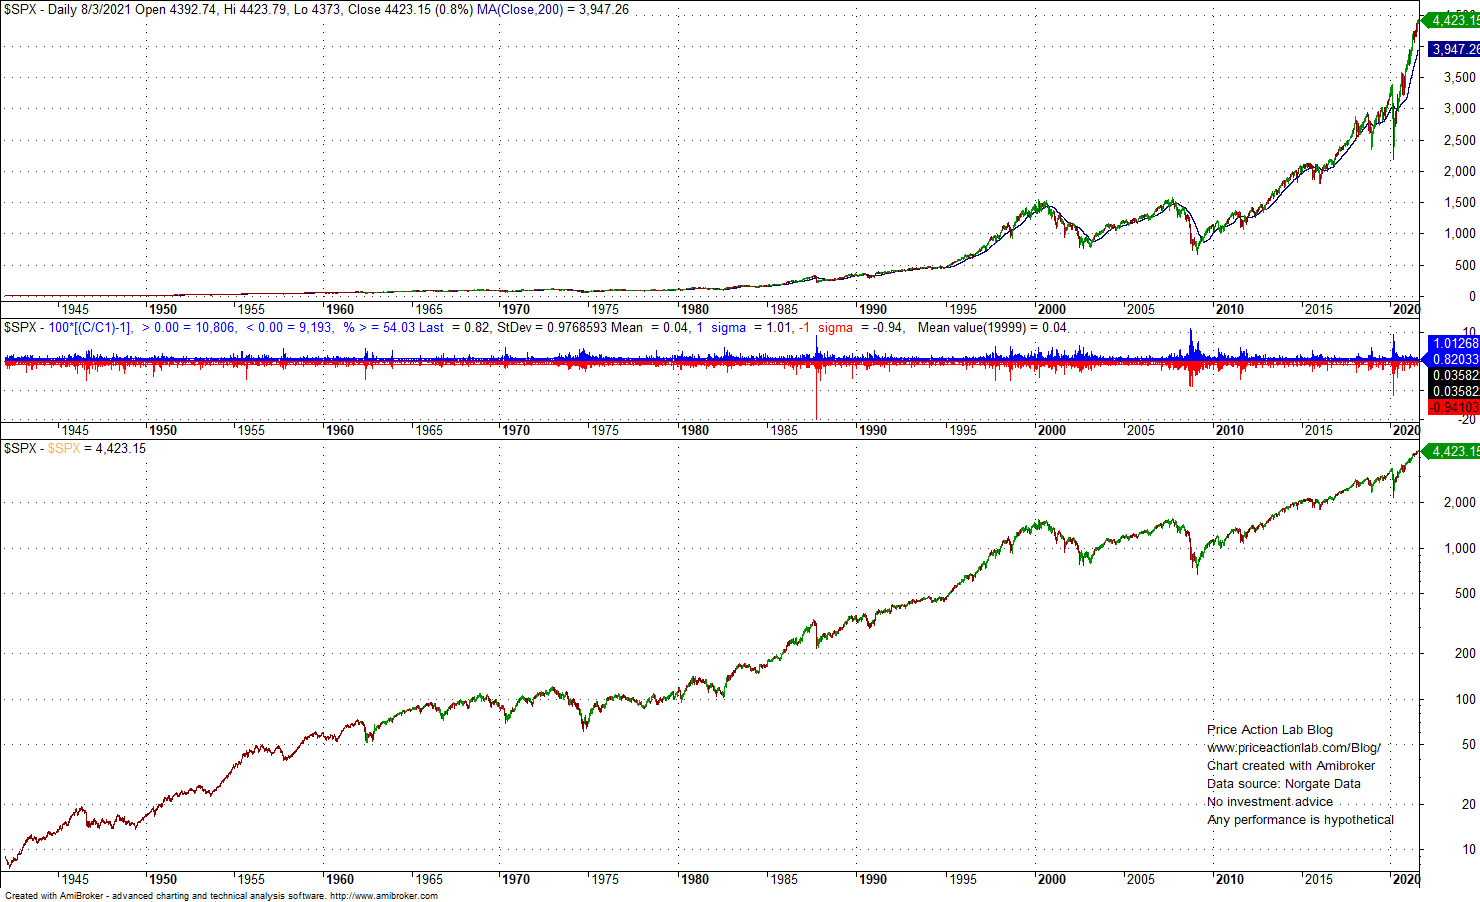
The top chart has linear scale and it appears that after 2010 there is a deviation from some approximate linear trend.
The second chart shows the daily returns of S&P 500 along with their mean, standard deviation and hit rate for positive outcomes. Mean is 0.04%, standard deviation is 0.98% and hit rate for up days is nearly 54%.
The bottom chart shows what happens if the observable is the log of price. Despite the volatility from corrections and bear markets, the log of price shows more or less a linear trend.
Maybe looking at stock market index is little confusing so let us do a simulation of a multiplicative process as follows: We start with one unit of equity and we toss a biased coin with probability of heads equal to 54%, heads win 0.04% of equity and tails lose 0.04% of equity. Below is one random path of this multiplicative process.
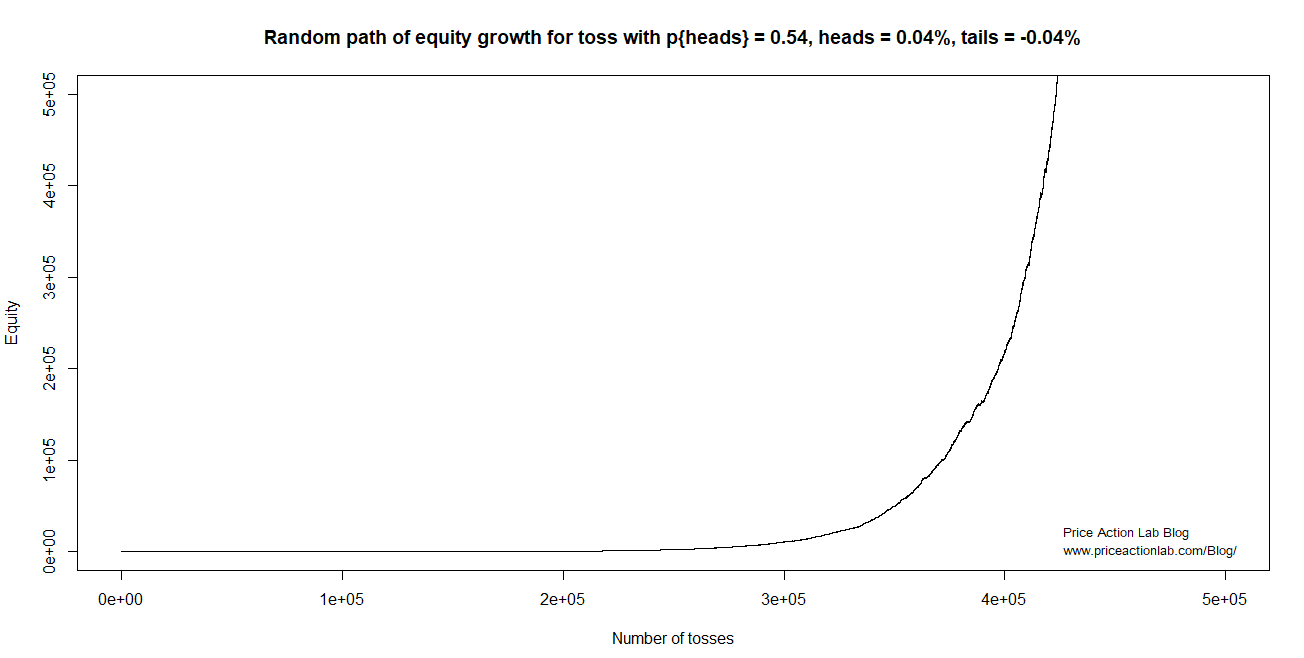
After about 30,000 tosses the equity of the process start going exponential on the linear scale. There is no bubble in the simulation; this only appears to be the case because of the choice of scale. If we look at the log of equity instead, this is what we get.
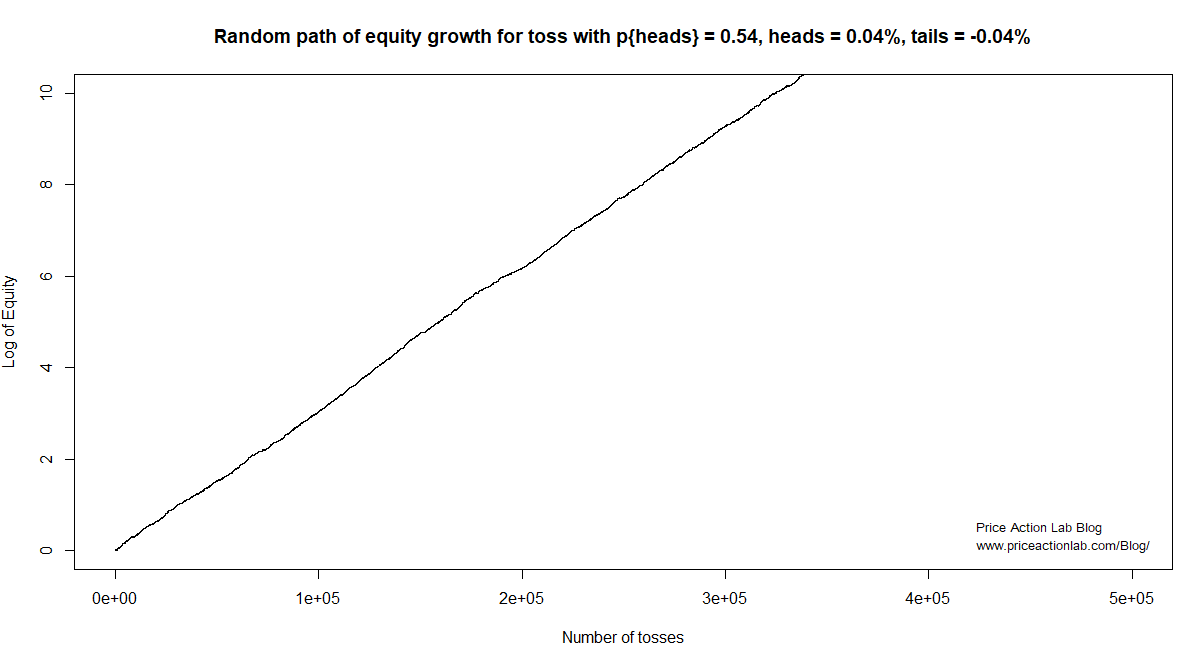
Growth of the log of equity is approximately a straight line. The log of equity removes the distortion due to low values and reveals percentage changes. In the above chart there is no detectable change in the dynamics of a process when log of equity is considered. But when linear scale is used it may appear that the process is changing and from linear it is becoming exponential.
Laypeople who are not familiar with log charts may interpret them as potential bubbles. Below is the chart for AMZN.
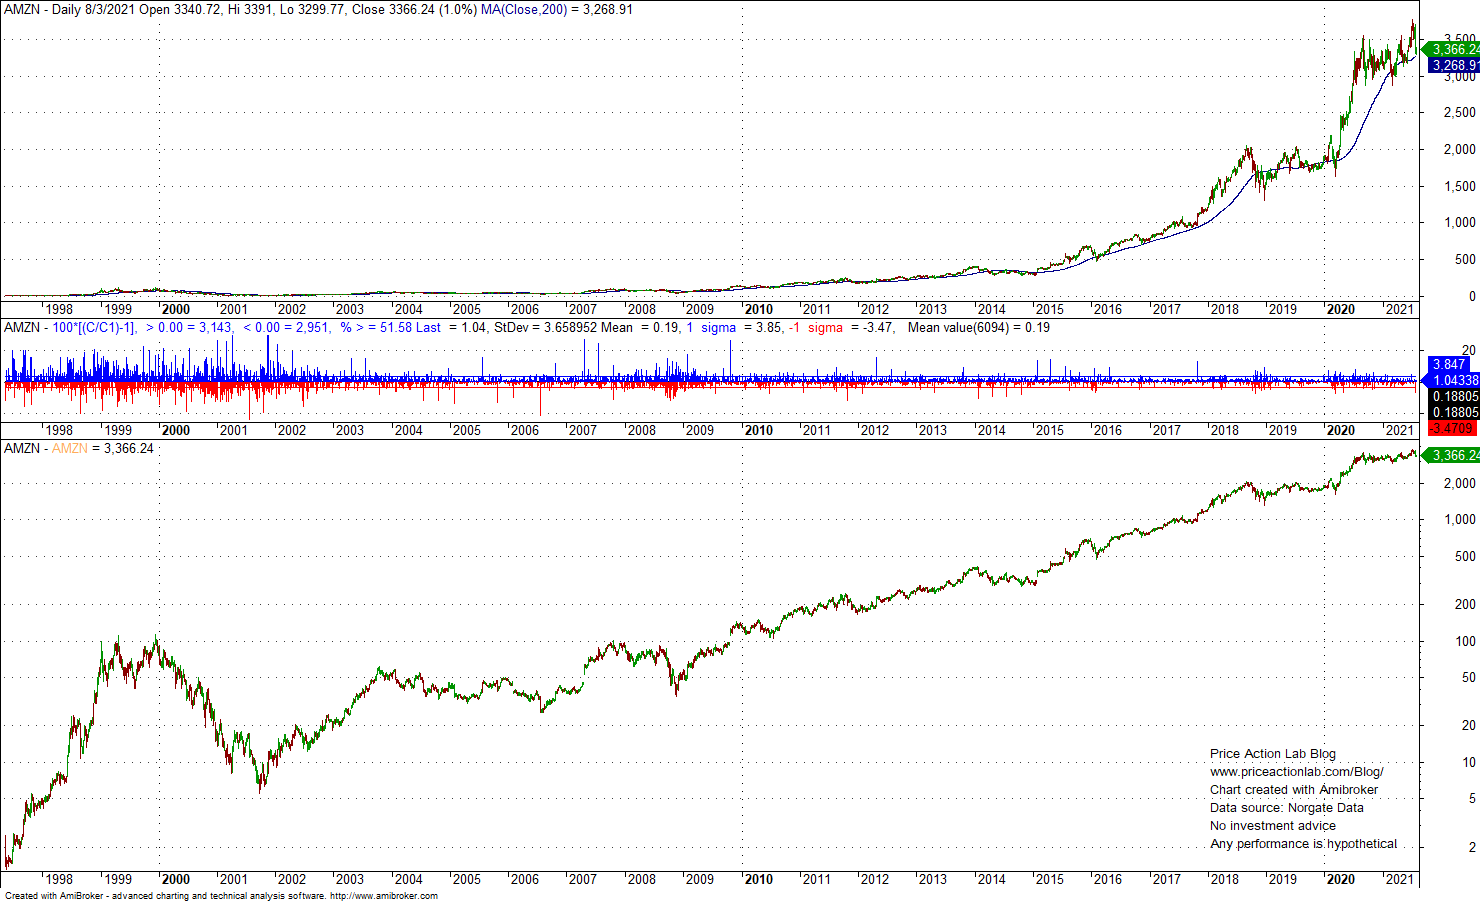
Although after 2015 someone could claim AMZN is a bubble stock, the log chart shows approximate linear trend. In fact, AMZN was maybe a bubble stock in the early days after IPO from 1998 to 2000 and then crashed, as shown in the above chart. But someone who looks at the linear chart could get this wrong and the other way around.
Since equity growth in the markets can be modeled as multiplicative process, it is often hard to distinguish genuine uptrends and a bubble state. The answer lies in fundamentals. However, the point of this article is that a market is not necessarily a bubble if it grows exponentially when the scale is linear. Charts do not tell the full story and especially longer-term linear charts can be misleading. When someone points to exponential growth on a linear chart in an attempt to justify the bubble label, this may be more of an agenda than expert analysis.
Disclaimer: No part of the analysis in this blog constitutes a trade recommendation. The past performance of any trading system or methodology is not necessarily indicative of future results. Read the full disclaimer here.
Charting and backtesting program: Amibroker. Data provider: Norgate Data
If you found this article interesting, you may follow this blog via RSS or Email, or in Twitter
Price action Lab premium Content: By subscribing you have immediate access to hundreds of articles. Premium Insights subscribers have immediate access to more than a hundred articles, Premium Articles and Market Signals subscribers have immediate access to hundreds of articles that include the trader education section and All in One subscribers have access to all past premium content. Click here for more details.

Price Action Lab Blog Premium Content


