Given the performance data year-to-date, equity index publishers appear to be better stock pickers and ETPs providers. They also have the advantage of passive investors following the indexes. That’s two strikes against stock picking.
Stock indexes and some ETPs are rebalanced periodically to maintain an upward positive drift. Then, this drift is reflexively maintained during bull markets by passive investing in the indexes. Recently, stock picking with the goal of outperforming indexing shows poor performance. Reflexivity cannot be bitten.
We look below at year-to-date performance of three total return indexes and compare to a popular ETF:
NDXTR: NASDAQ-100 total return index
NGXTR: NASDAQ Next Generation total return index
NXTQTR: NASDAQ Q-50 total return index
ARKK: ARK Innovation ETF
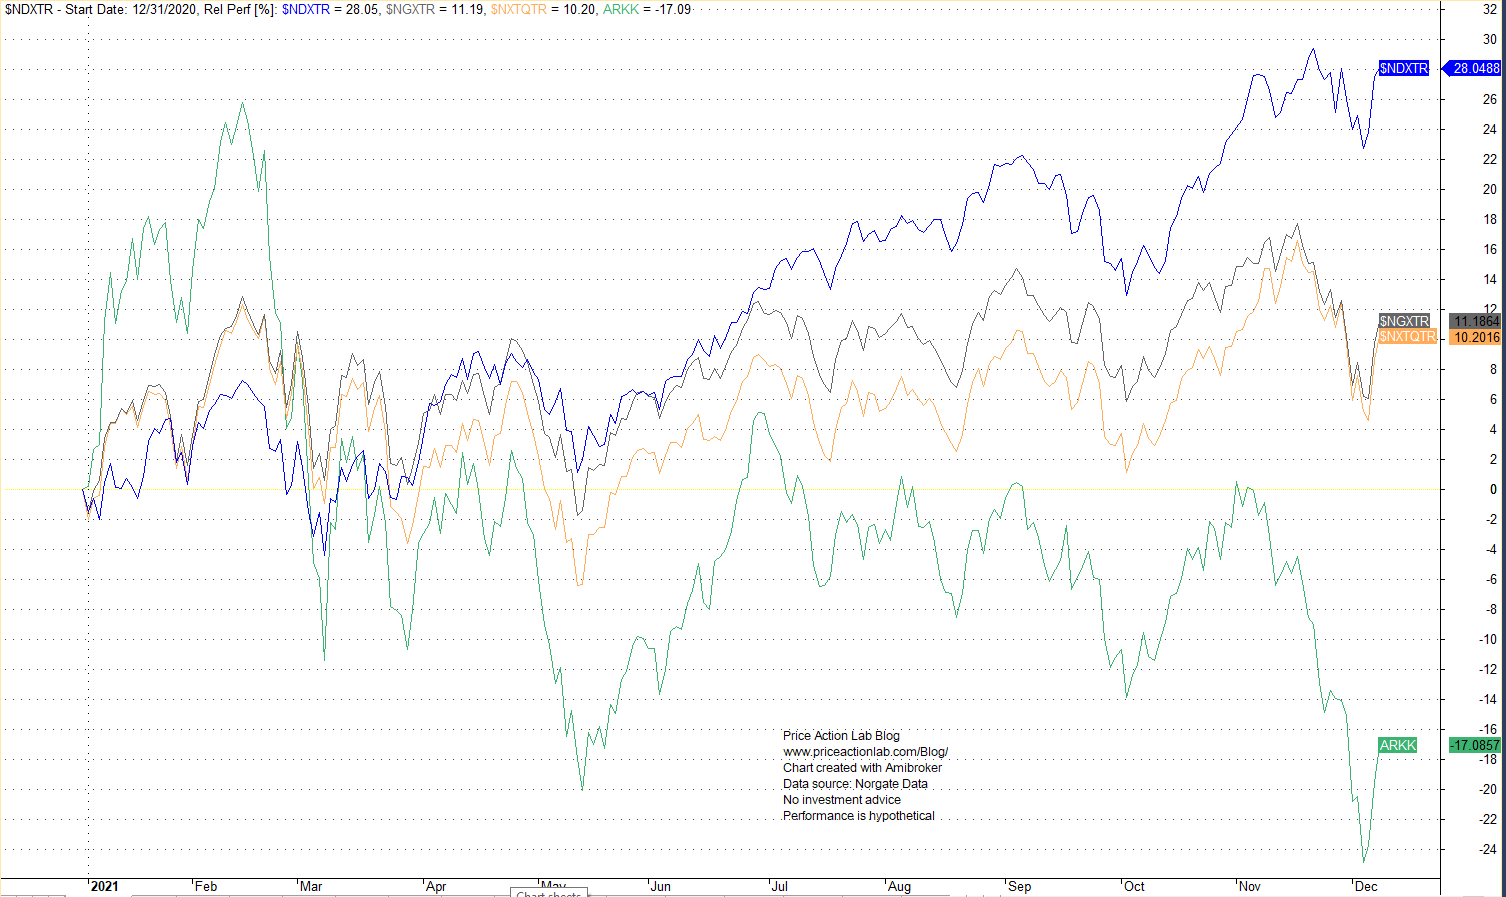
All NASDAQ total return indexes are up year-to-date but ARKK is down. The performance table below includes drawdown from all-time-highs for the year:
| Year-to-Date Return | Drawdown from ATH | |
| NGXTR | +11.2% | -5.6% |
| NXTQTR | +10.2% | -5.5% |
| NDXTR | +28% | -10.5% |
| ARKK | -17.8% | -34% |
It’s hard to beat reflexivity. Passive investments following indexes only reinforce the uptrend while stock pickers like ARKK usually face significant challenges when a few of their top picks underperform. The index rebalancing team is ready to pull the trigger and replace losers with winners and even winners with better winners. They appear to have been effective over the years because they have reflexivity on their side, i.e., if there is a bull market, stock indexing cannot go wrong.
How to beat stock indexing and generate alpha?
Apparently, not with the way some funds are doing it. In my humble opinion, fund managers should become better practitioners than fancy allocators and statisticians. Why not using some moving averages or some old fashion indicators? Then maybe that could help in the construction of products such as the BlackRock Innovation and Growth Trust:
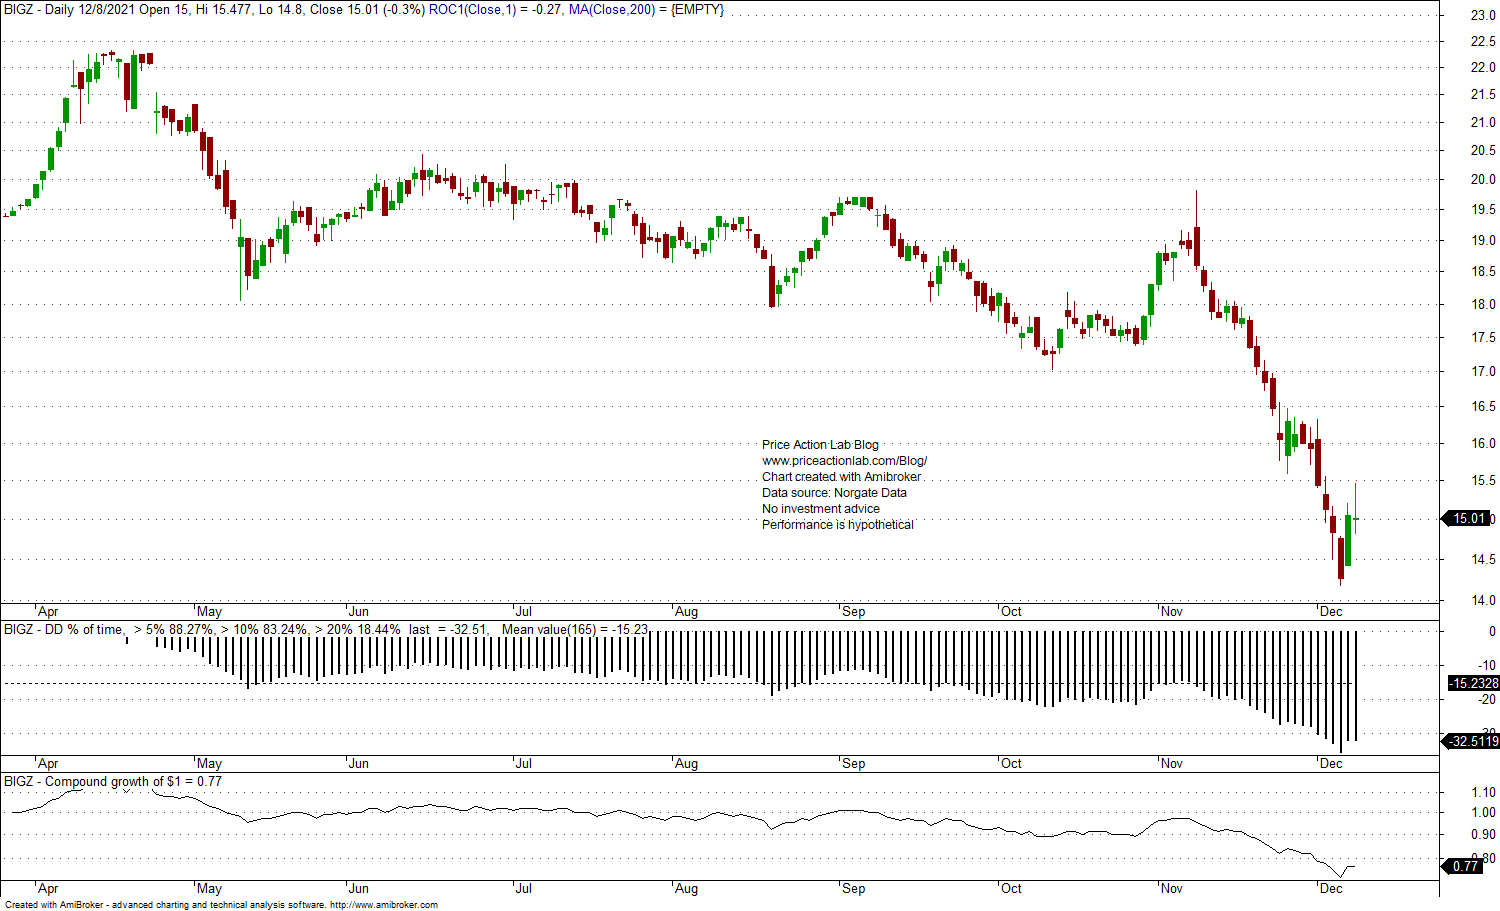
The Trust is down 33% from all-time highs since inception on March 26 of this year with $1 turning to $0.77 in a short period of time.
Given the inflows to passive indexing but also the increase in volatility, even risk-adjusted returns may be difficult to realize in coming years. The game is becoming harder and a huge consolidation in fund management business will probably take place in coming years. Small funds with low AUM operated by practitioners with many years of experience may be able to generate alpha but given they won’t be tempted to accept more funds. This is what CTAs did after the exceptional performance of the 90s and ended up with sub 2% annualized return afterwards due to capacity and liquidity constraints. Look for some changes in fund management business in the near future. No one cares about the podcasts, they only look at the returns.
Charting and backtesting program: Amibroker. Data provider: Norgate Data
You may follow this blog via RSS or Email, or in Twitter. Disclaimer
10% off for blog readers and Twitter followers with coupon NOW10