


As the data since 1942 show, negative real interest rates haven’t been a bad environment for the stock market. If fact, a significant fraction of the annualized return of S&P 500 has been generated during periods when inflation was higher than the Fed Funds rate.
Before I start with the analysis, caveat emptor: There are many confounding variables in the markets and the system is highly complex. Oversimplified macro and/or technical analysis may yield models with high error. In addition, market data science isn’t as straightforward as it may appear. To illustrate this last point let us look at the chart of real rates that appeared in financial media and blogs after the release of CPI on January 12, 2022.
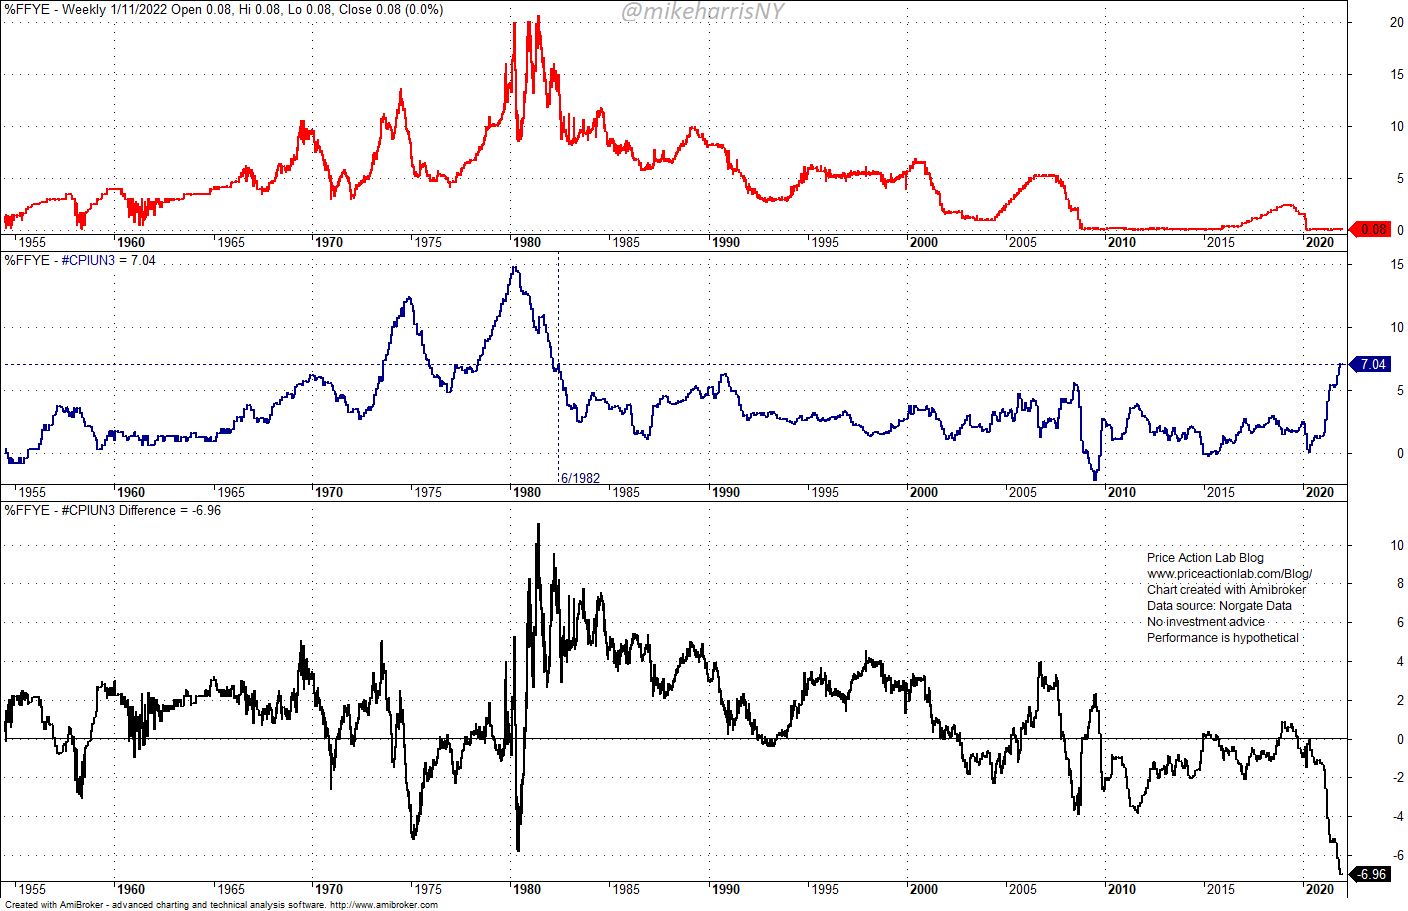
The chart shows the real Fed Funds rate, YoY CPI inflation and the difference of the two, which is the “real rate” at 6.96% as of January 12, 2022, and at the lowest level since July 1942. The above chart is in the weekly timeframe.
However, note that the Fed Funds rate is a daily series while the CPI is a monthly series. Therefore, when subtracting the two, the timeframe matters. For example, below is the same chart in monthly timeframe.
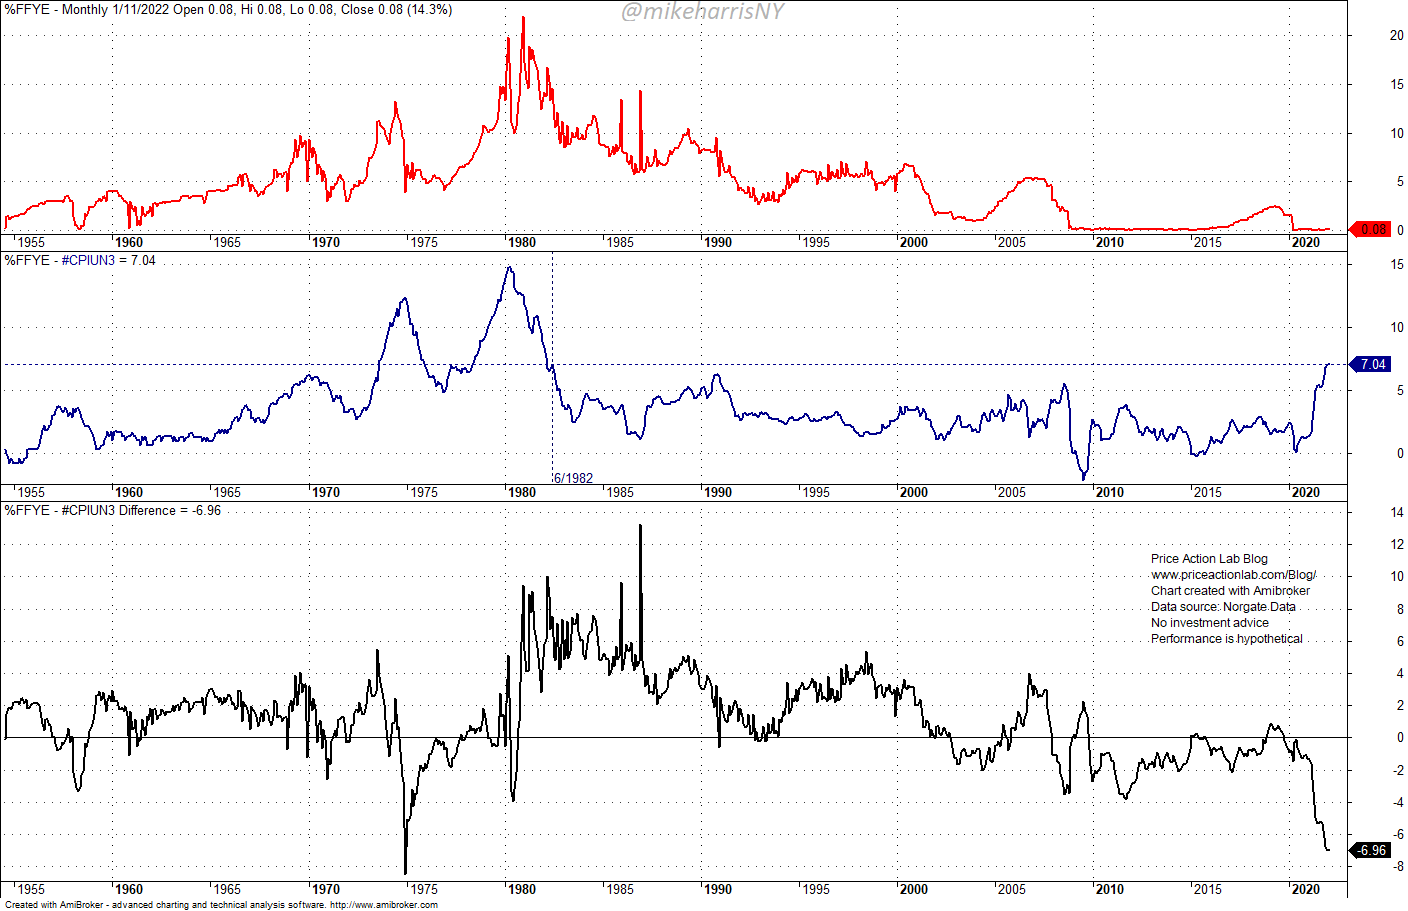
In the monthly timeframe, the real rate is not lowest in the period considered. This is because monthly differences are usually based on monthly closing levels. One could use more advanced ways of generating the chart that take the average in the daily timeframe, for example, but this is a minor point for the purposes of this article. The difference in above two charts is to serve as a warning that when looking at macro charts indicating extreme levels those may disappear depending on the timeframe used. Similar problems may be encountered when using machine learning algos and other more advanced quantitative methods.
In this article, we are mainly interested in the performance of the S&P 500 during positive and negative real interest rates periods. The results of the backtest (no commissions) for fully invested equity (hypothetical since S&P 500 is not tradeable) are shown below. Backtest period is from 07/01/1942 to 01/12/2022.
| Real IR > 0 | Real IR < 0 | Buy and Hold | |
| Annualized Return | 3.9% | 2.6% | 8.3% |
| Max. Drawdown | -51.2% | -59% | -56.8% |
| Sharpe Ratio | 0.35 | 0.29 | 0.54 |
| Number of Trades | 43 | 43 | – |
| Win Rate | 65.1% | 60.5% | – |
Summary
– During period of positive real interest rates, the S&P 500 has performed best.
– During periods of negative real interest rates, the S&P 500 has generated a significant fraction of its buy and hold annualized return.
Negative real interest rates haven’t had negative impact on the market historically but, as already noted, the system is too complex and there are confounding variable that could impact any conclusions.
Premium Content 10% off for blog readers and Twitter followers with coupon NOW10
Disclaimer: No part of the analysis in this blog constitutes a trade recommendation. The past performance of any trading system or methodology is not necessarily indicative of future results. Read the full disclaimer here.
Charting and backtesting program: Amibroker. Data provider: Norgate Data
If you found this article interesting, you may follow this blog via RSS or Email, or in Twitter.


