


This has only occurred once during 2011 with the CRB index up eleven weeks in a row but the gain was only 11.9%. The gain after current 11-week win streak is 33.2%.
Below is the chart with 11-week “win streak” indicator for CRB Index.
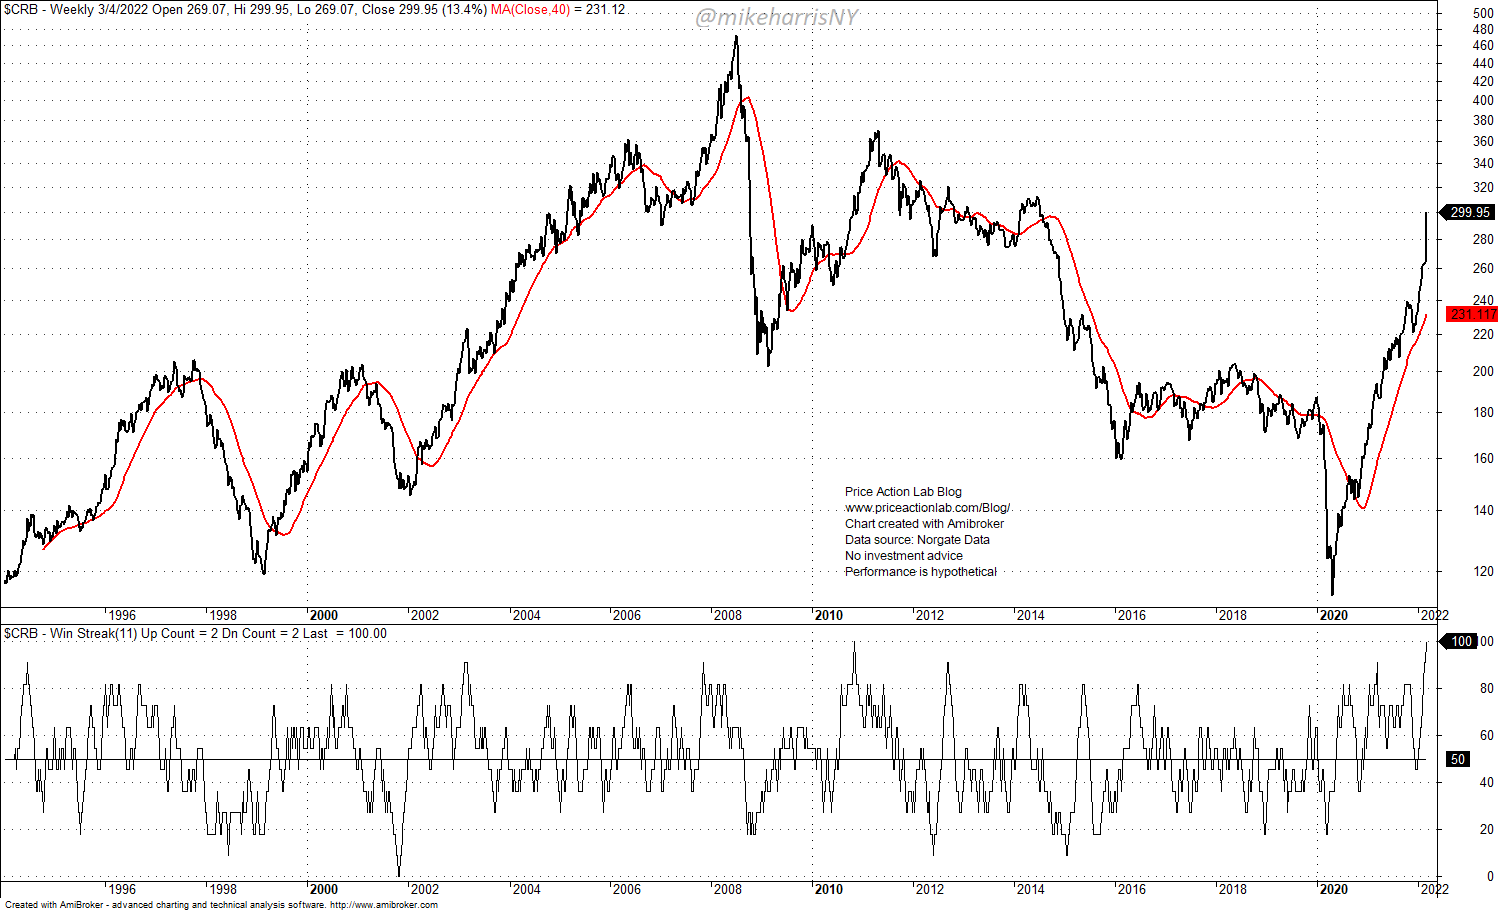
The indicator has reached 100%, or up in all 11 weeks. This has also occurred in October 29, 2010. The reason for the uptrend in the index from February 2009 to April 2010 was mainly due to fears of inflation, or even hyperinflation, caused by quantitative easing after the Great Financial Crisis. The index gained about 83% in that period. When it became evident there wouldn’t be any significant inflation and many pundits and economists were wrong, the index crashed.
The current uptrend started near the bottom of the 2020 pandemic crash and is still in place. The gain in this period is 182.2% !!!
Last December there were signs the index uptrend was coming to an end but the rising geopolitical tensions that led to a war in Europe are main driver behind the gains and parabolic rise.
As I have indicated to our subscribers several weeks ago, the CRB is one the most important indexes to watch during this time.
Premium Content 10% off for blog readers and Twitter followers with coupon NOW10
Disclaimer: No part of the analysis in this blog constitutes a trade recommendation. The past performance of any trading system or methodology is not necessarily indicative of future results. Read the full disclaimer here.
Charting and backtesting program: Amibroker. Data provider: Norgate Data
If you found this article interesting, you may follow this blog via RSS or Email, or in Twitter.


