


The S&P 500 is down 12.4% from all-time highs while the NASDAQ-100 has fallen near bear market territory. This is no time for statistics but for tail risk hedging.
Some technical analysts are pointing to statistics that include data from the Great Depression and claim the S&P 500 is down a little less than the media drawdown. While this is true, the median is sensitive to choice of lookback period. If the lookback period starts in 1942, the median drawdown is around -6%.

Mean drawdown since 1942 is -9.7% while the median is -5.6%. However, these statistics are at present time not very relevant when the NASDAQ-100 is already near bear market territory and there is a serious geopolitical conflict.
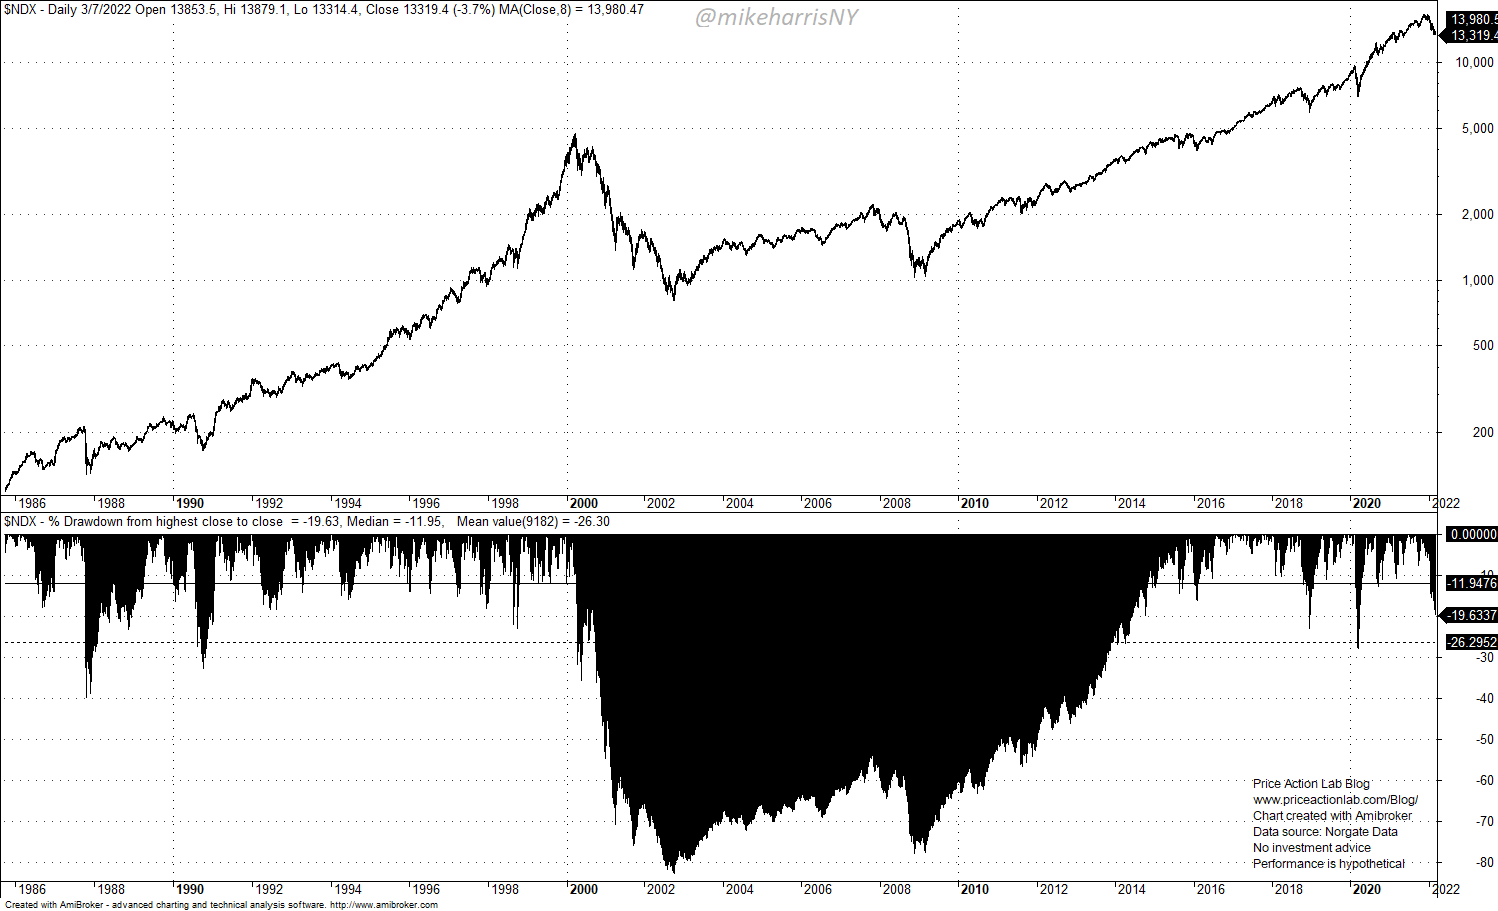
Drawdown for NASDAQ-100 is -19.6% while the median is -12% and the mean is -26.3%.
Statistics are fun but more important are the ways for investors to hedge tail risk. Some analysts in 2002 and 2008 thought the market would rebound but it continued falling and drawdown increased in excess of 50%.
For people close to retirement, 50% drawdown could mean crossing the poverty line. Therefore, some technical analysts should be more careful with their upbeat calls about limited losses based on statistics. This time is different; there is a war.
There may be a quick solution to current geopolitical conflict and war and we all hope for one. But no one knows and especially technical analysts. If there is a solution, then markets may or may not rebound but if there isn’t one soon, the rout could continue and we may see drawdown levels exceeding those in 2003 and 2008.
This is no time to be upbeat, or contrarian, but instead humble and careful.
Premium Content 10% off for blog readers and Twitter followers with coupon NOW10
Disclaimer: No part of the analysis in this blog constitutes a trade recommendation. The past performance of any trading system or methodology is not necessarily indicative of future results. Read the full disclaimer here.
Charting and backtesting program: Amibroker. Data provider: Norgate Data
If you found this article interesting, you may follow this blog via RSS or Email, or in Twitter.


