


In hindsight, long-term charts impose the illusion of passive investing. The fact is that there are lucky and unlucky passive investors.
The timing of their investment in an index fund determines whether they are lucky or unlucky passive investors. The chart below is self-explanatory. It doesn’t include total returns, but those change only the duration of the periods indicated by one or two years.
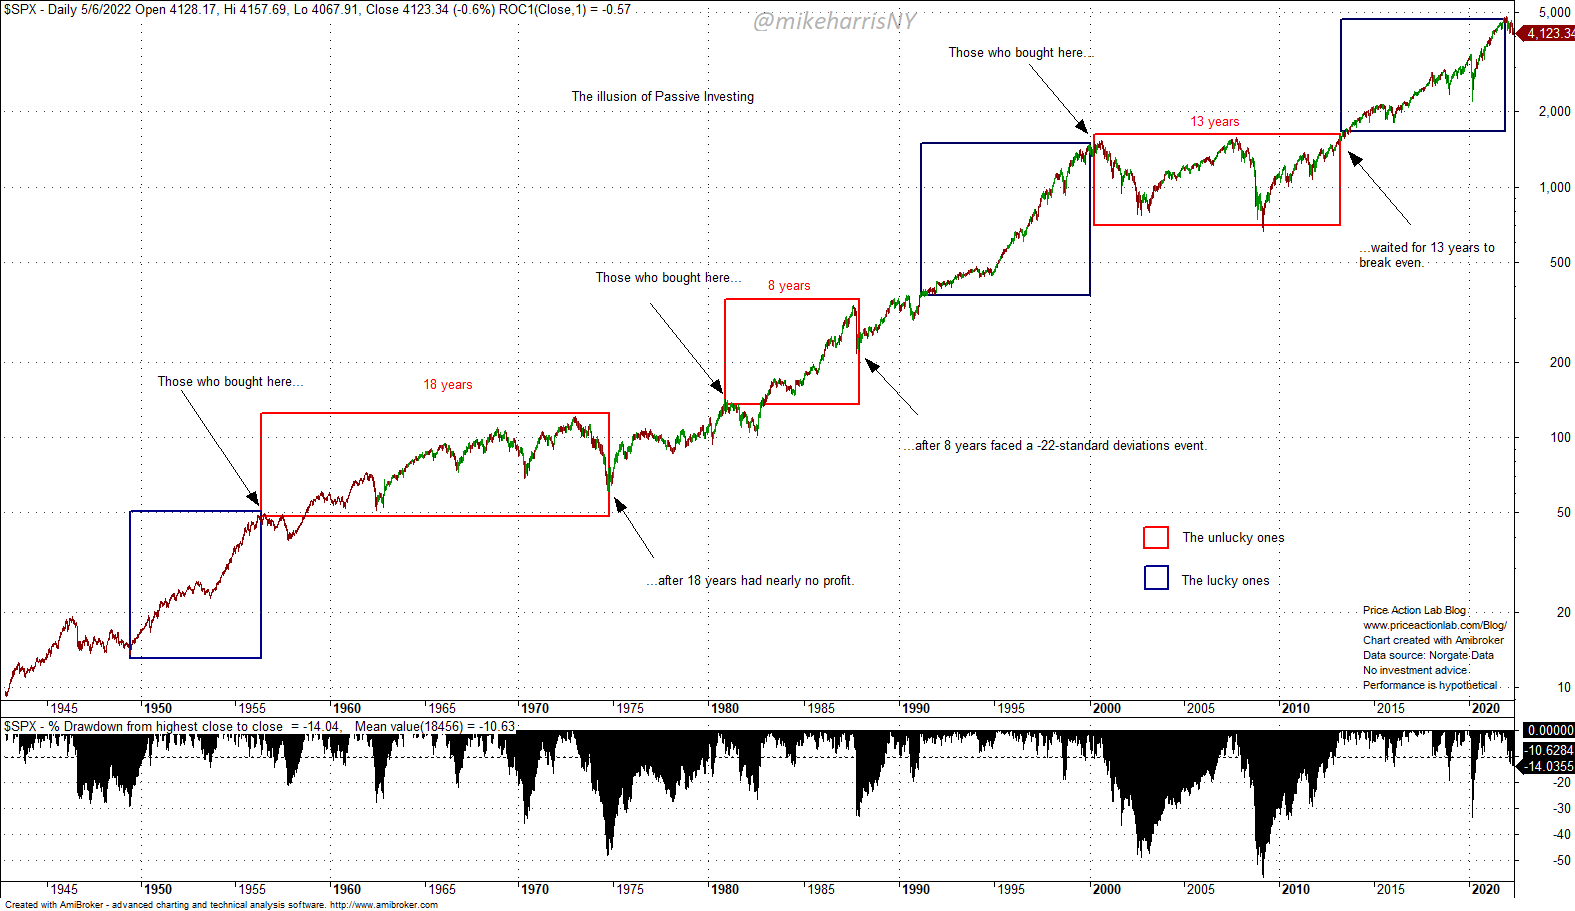
Passive investors do not face a lower risk when compared to those investors who attempt to time the markets. The chart indicates that those who bought in mid-1949, the early 90s, or after the bottom of the GFC were lucky, while those who bought near the tops of 1956 and 2000 were unlucky. Those who bought in the early 1980s faced the tail event of October 1987.
No one knows how investors reacted during different periods, whether they sold and got out with a loss or added to their investments. The claim of glorious passive investing is based on hindsight and many unrealistic assumptions of the kind, “if you had bought in _ _ _ _, you would have made _ _+ % annualized.”
Passive investing success is an illusion due to hindsight. It takes as much effort to be a successful passive investor as it does to follow a simple momentum strategy. These two may be equivalent in some ways.
Premium Content
Disclaimer: No part of the analysis in this blog constitutes a trade recommendation. The past performance of any trading system or methodology is not necessarily indicative of future results. Read the full disclaimer here.
Charting and backtesting program: Amibroker. Data provider: Norgate Data


