


What is the probability of another down year in the stock market after a down year? Some answers in financial blogs and media are wrong. Below is how the correct value of this probability is calculated and the assumptions.
We will work with Dow Jones Industrial Average historical yearly data going back to 1909. The first assumption is that yearly returns are independent. This is a reasonable assumption and the autocorrelation analysis confirms it, so we will skip the details. The second assumption is that the yearly returns are approximately normal. If the two assumptions are false, then determining the probability of a down year after a down year is complicated. The calculation may also be impossible based on the available samples.
Below is a histogram of yearly Dow Jones Industrial Average returns.
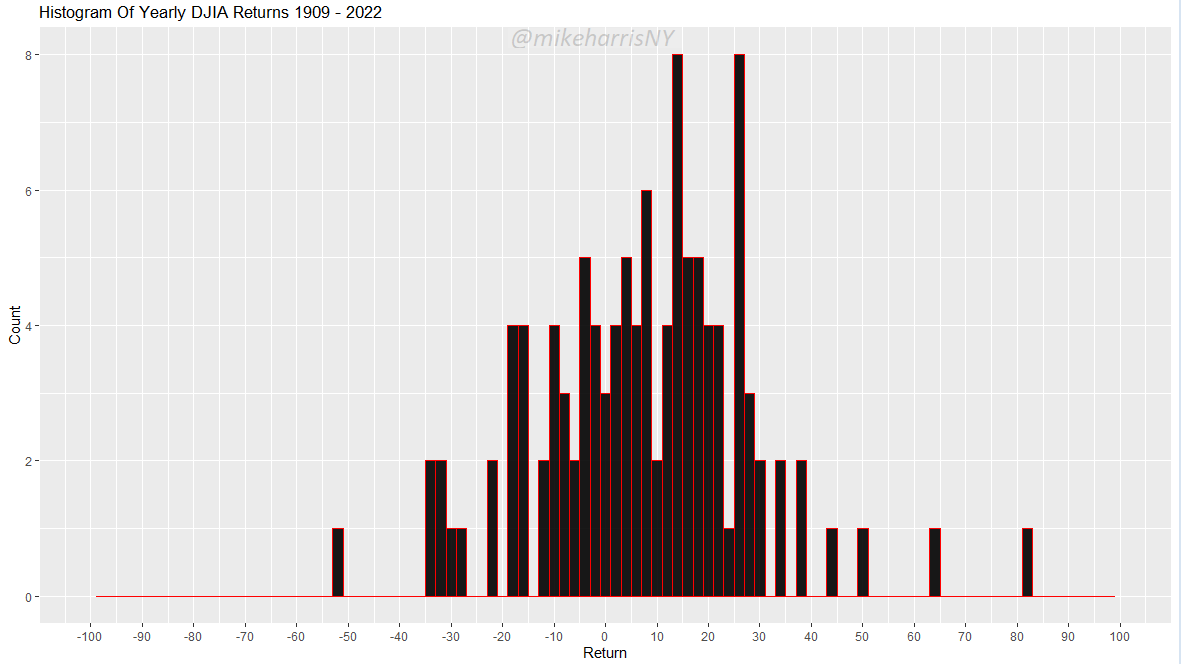
Does this distribution of yearly returns diverge significantly from a normal distribution?
Application of the Darling-Anderson normality test yields A = 0.48728 and p-value = 0.2201. The null hypothesis of normality cannot be rejected. The Shapiro-Wilk normality test is considered more accurate. It yields W = 0.98054 and p-value = 0.09884. We can say that according to this more accurate test, the distribution is borderline normal.
The yearly DJIA chart below shows the returns histogram and the four possibilities: a down year after a down year, a down year after an up year, an up year after a down year, and an up year after an up year. Note that down years after up years and up years after down years have the same count of 25 occurrences in 113 years. Down years after down years have occurred 11 times and up years after up years, 49 times. The index has been up 66.37% of the time.
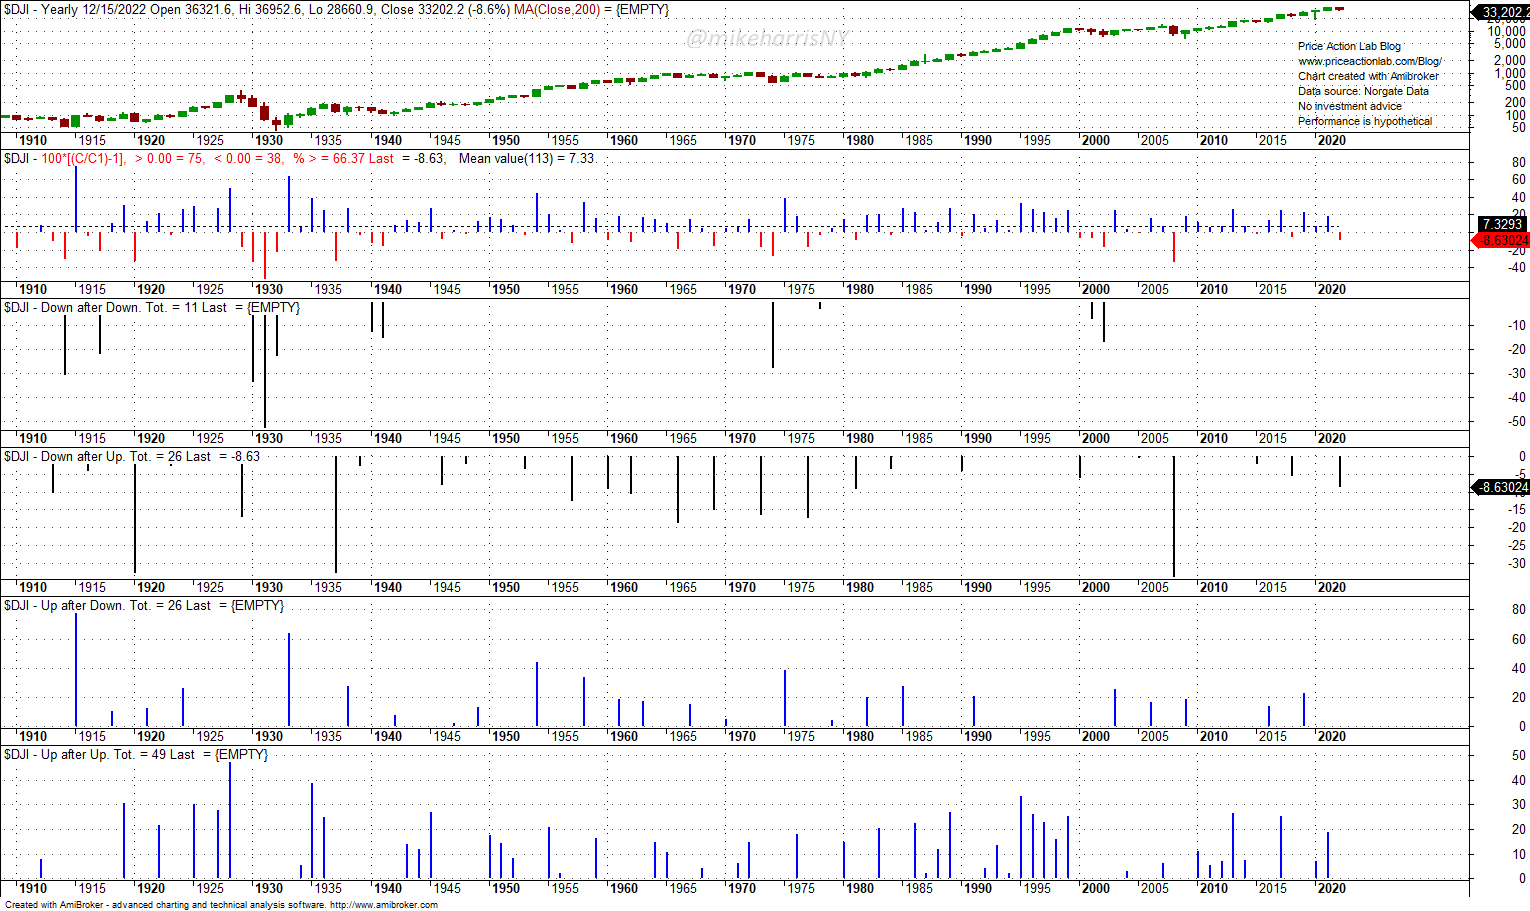
The quick, but wrong, calculation of the probability of a down year after a down year is to divide 11 by 113, or 0.0973 (9.73%).
This is the wrong probability because we are not looking for a down year after down year occurrence, but a down year given a down year already. This is the conditional probability:
P(Down year/Down year) = P (Down Year ∩ Down Year)/P(Down Year)
If we plug in the numbers from the above chart, we get
P(Down year/Down year) = (11/113)/(38/113) = 0.289 = 28.9%
Therefore, if we observe a down year, the probability it is followed by another down year is about 29%. This is a high probability.
By calculating frequencies and equating them to probability we made the important assumption that the limits for sufficient samples of these frequencies exist. This may not be the case in general.
We can summarize by noting that the probability of a down year after a down year in the stock market is not as low as people think but closer to 50%.
Disclaimer: No part of the analysis in this blog constitutes a trade recommendation. The past performance of any trading system or methodology is not necessarily indicative of future results. Read the full disclaimer here.
Charting and backtesting program: Amibroker. Data provider: Norgate Data


