


Inflation paused in January. The long-term correlation between inflation and large caps is close to zero but with high variability.
Based on the most recent CPI data from January of this year, there is no sign that inflation is dropping quickly.
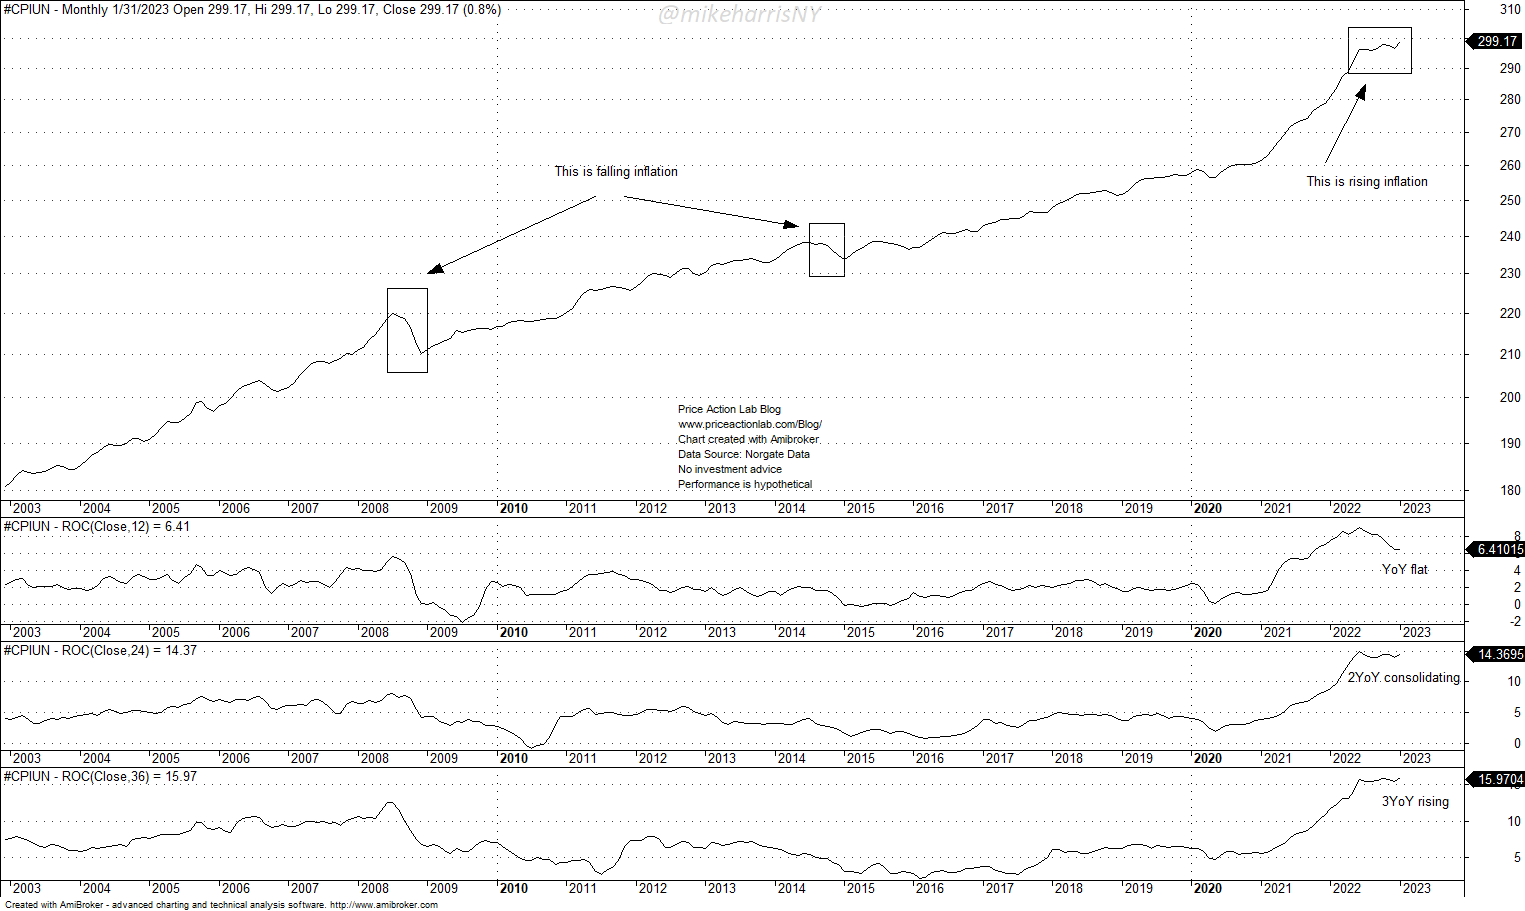
Depending on how inflation is “defined” and what metric is used, one could say that inflation is going up, down, or staying the same.
According to the CPI chart, if someone focuses on price levels, then inflation is rising. The only two recent periods that saw a falling level of prices were 2008 and 2014, as marked in the above chart.
When the common “YoY” definition is used, inflation is flat or falling. This is an arbitrary metric for inflation and refers to the speed of inflation, not the level. For inflation to fall according to this definition, the rate of change (ROC) must decline significantly.
For someone with a 2-year window, inflation (speed) is consolidating, and for a 3-year window, the speed is rising.
The long-term 0-lag correlation of CPI and SPX is close to zero. The standard deviation is 0.21.
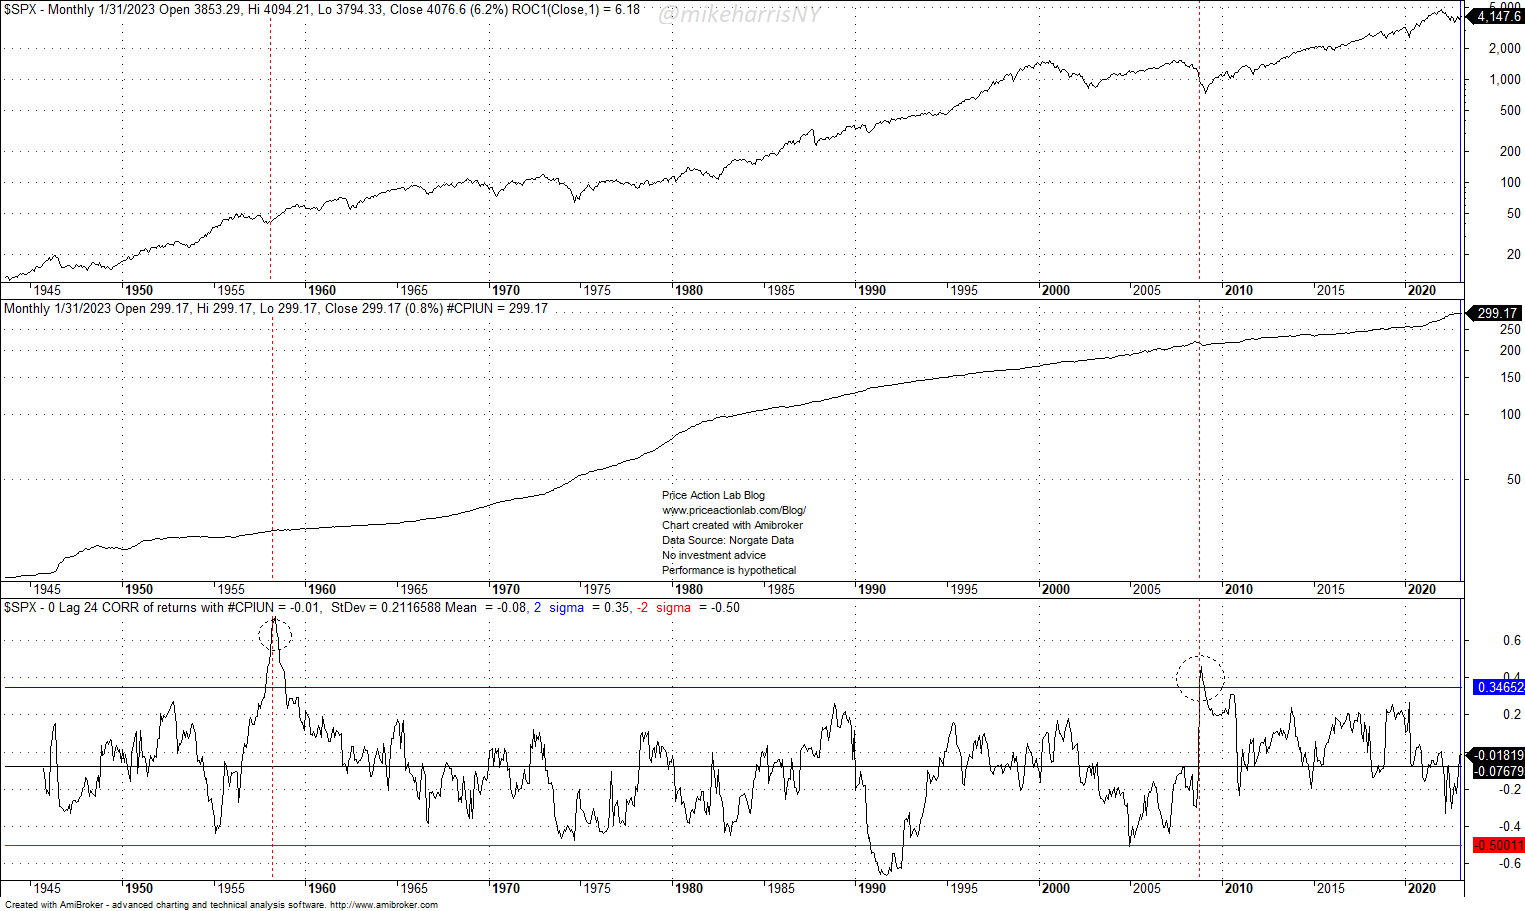
In the 1950s and 2008, the vertical red marks indicate correlation values greater than two standard deviations from the mean. The market experienced a correction in the former case and a bear market with deflation in the latter. The current value of the correlation is near the long-term zero mean.
Anyone trying to forecast market direction using inflation as a guide is looking at randomness. There is little association in the long term, and the short term is random. The best indicator to use in forecasting market direction is the price itself.
10% off all premium content with Discount Code NOW10
By subscribing you have immediate access to hundreds of articles. Premium Insights subscribers have immediate access to more than a hundred articles and All in One subscribers have access to all premium articles, books, premium insights, and market signals content.
Free Book
Subscribe for free notifications of new posts and updates from the Price Action Lab Blog and receive a PDF of the book “Profitability and Systematic Trading” (Wiley, 2008) free of charge.
Specific disclaimer: This report includes charts that may reference price target levels determined by technical and/or quantitative analysis. No charts will be updated if the market condition changes affect the charts’ levels and/or any analysis based on them. All charts in this report are for informational purposes only. See the disclaimer for more information.
Disclaimer: No part of the analysis in this blog constitutes a trade recommendation. The past performance of any trading system or methodology is not necessarily indicative of future results. Read the full disclaimer here.
Charting and backtesting program: Amibroker. Data provider: Norgate Data
If you found this article interesting, you may follow this blog via RSS, Email, or Twitter.


