


Traders and analysts focus on recent price action, and often they may think there are irregularities. In most cases, historical analysis shows there is no deviation from normality, and the perception of irregularities is due to recency bias.
Recency bias is a cognitive bias that favors recent events over historic ones. I’ll give two examples below.
Example 1
Several traders have asserted that there has been an abnormal increase in the frequency of days with a reversal from the open, i.e., days when the market opens higher than the previous close but ends lower, or days when the market opens lower than the previous close but finishes higher. Below is a daily chart of the SPY ETF displaying the number of reversals in 252 days.
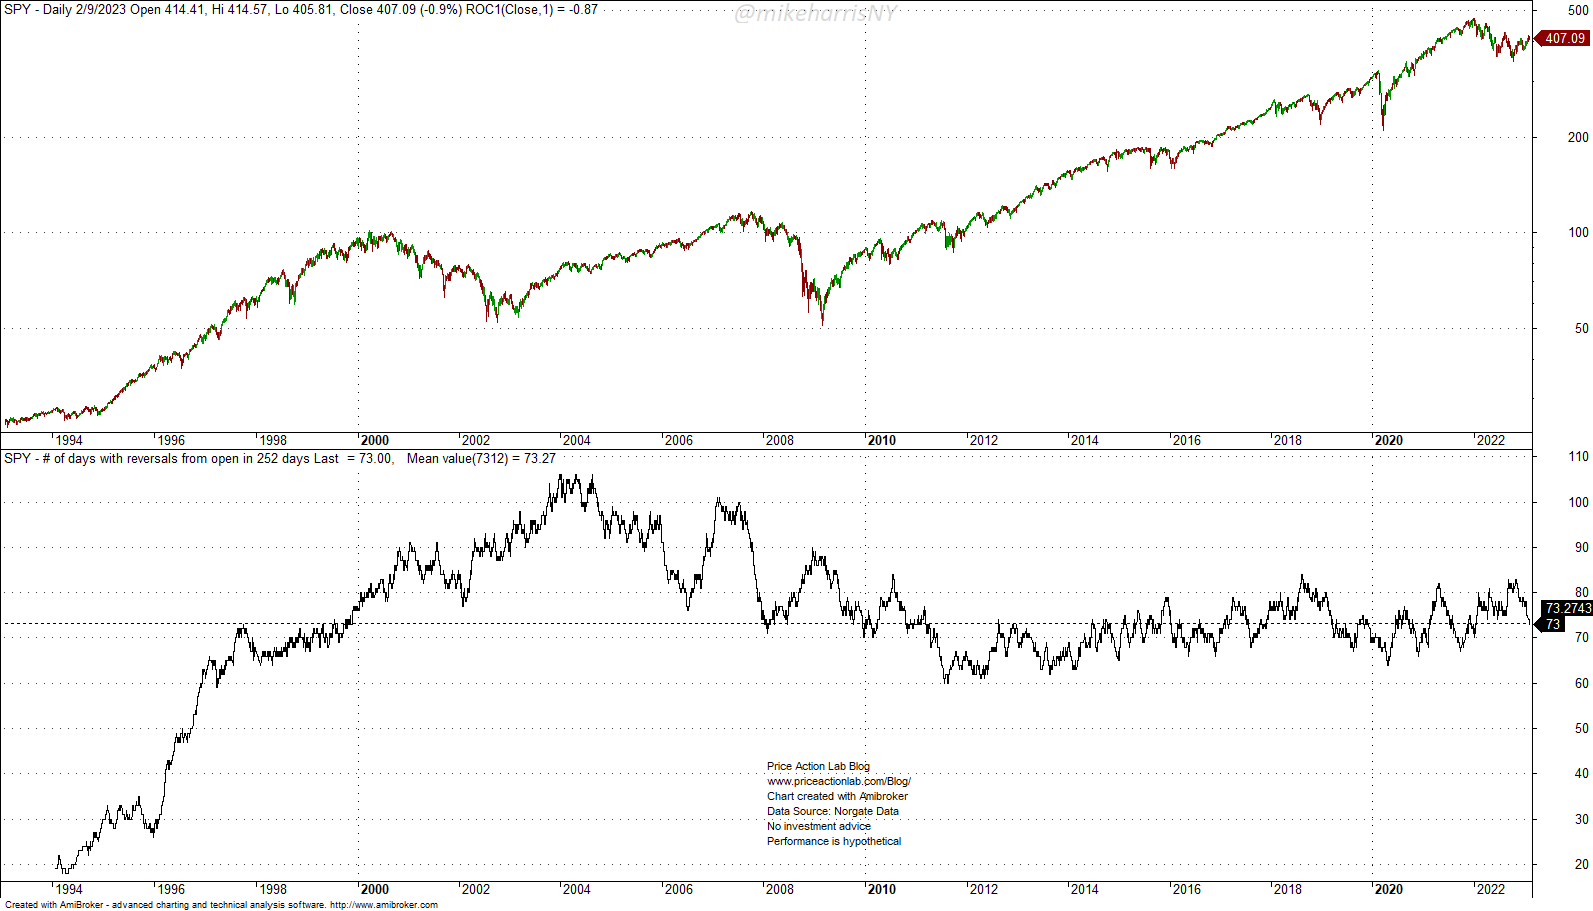
The current count is 73, which is the same as the average since the inception of the SPY ETF. There is no abnormality present, only recency bias.
Example 2
This example is more compelling due to the prevalence of references to the VIX indicator and the increased interest in volatility trading over the past few years.
Many traders believe that when the S&P 500 index rises, VIX must fall, and vice versa. Since VIX’s inception, this pattern has been predominant 78% of the time, and 22% of the time, the daily return signs of the S&P 500 and VIX indexes have been the same, as shown in the chart below.
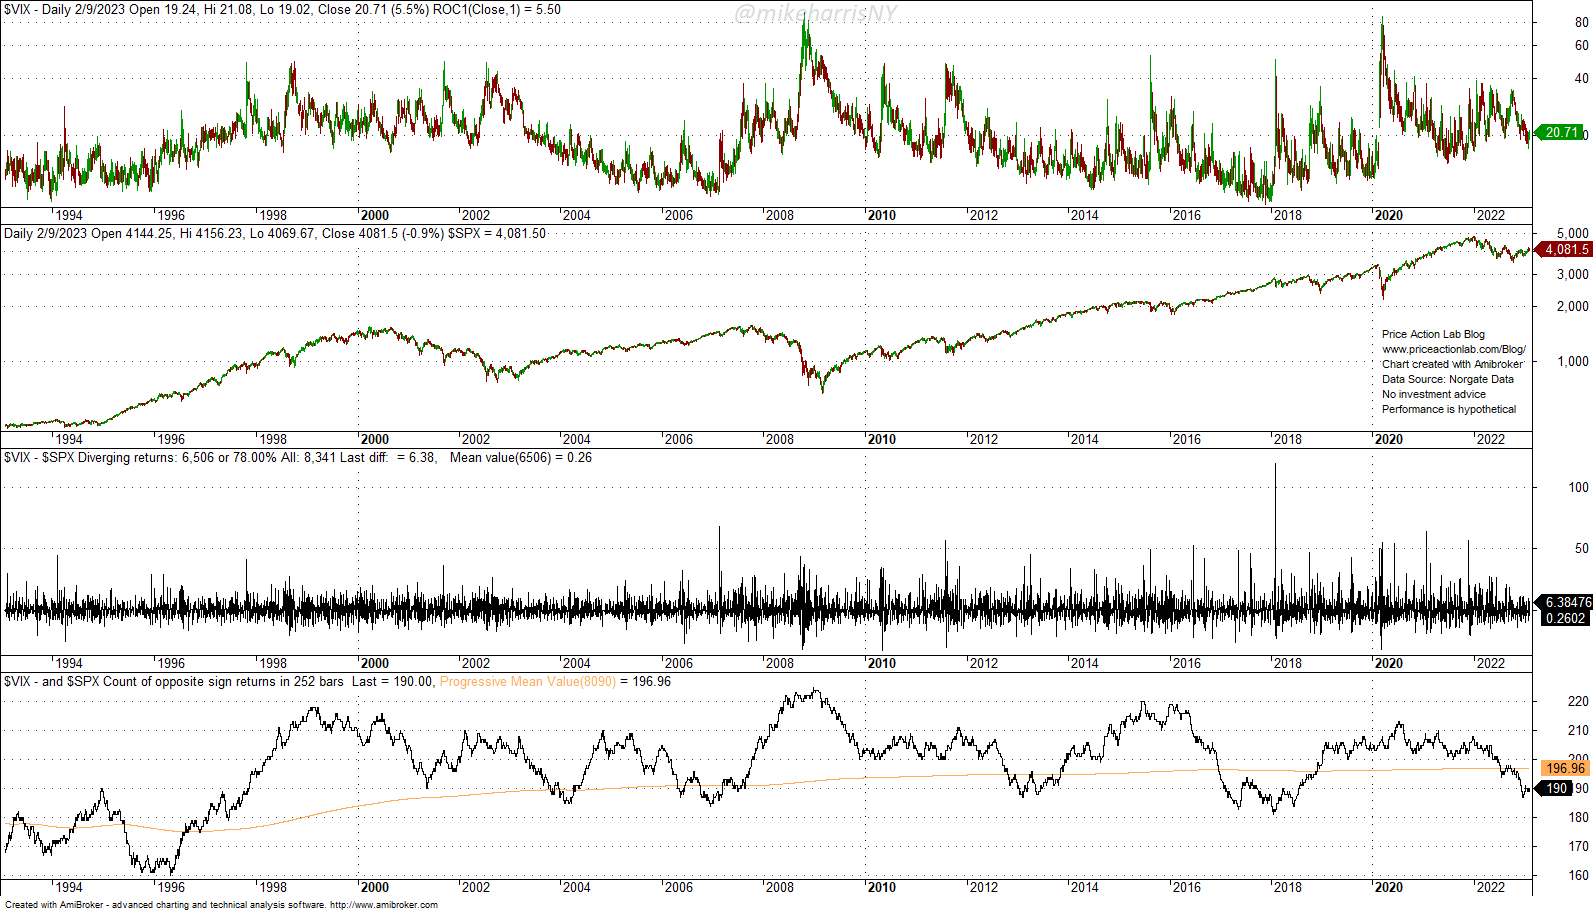
The last chart shows that the count of the S&P 500 and VIX opposite sign returns, as expected, is at 190, slightly below the long-term average of 197. There is no irregularity here.
When it comes to trading, recency bias is not always bad because the action can benefit from the recent dynamic; however, a trader or analyst must be quick to observe when the reversion to the mean occurs and the temporal irregularity disappears.
10% off all premium content with Discount Code NOW10
By subscribing you have immediate access to hundreds of articles. Premium Insights subscribers have immediate access to more than a hundred articles and All in One subscribers have access to all premium articles, books, premium insights, and market signals content.
Free Book
Subscribe for free notifications of new posts and updates from the Price Action Lab Blog and receive a PDF of the book “Profitability and Systematic Trading” (Wiley, 2008) free of charge.
Specific disclaimer: This report includes charts that may reference price target levels determined by technical and/or quantitative analysis. No charts will be updated if market condition changes affect the charts’ levels and/or any analysis based on them. All charts in this report are for informational purposes only. See the disclaimer for more information.
Disclaimer: No part of the analysis in this blog constitutes a trade recommendation. The past performance of any trading system or methodology is not necessarily indicative of future results. Read the full disclaimer here.
Charting and backtesting program: Amibroker. Data provider: Norgate Data
If you found this article interesting, you may follow this blog via RSS, Email, or Twitter.


