


The S&P 500 index is down 17% from all-time highs and under selling pressure. We look at similarities with past downtrends through the lenses of an unconventional indicator. Access to the article requires a Premium Articles or an All-in-One subscription.
Pattern-matching significance is impacted by regime changes, but it is always interesting to look at the past for hints.
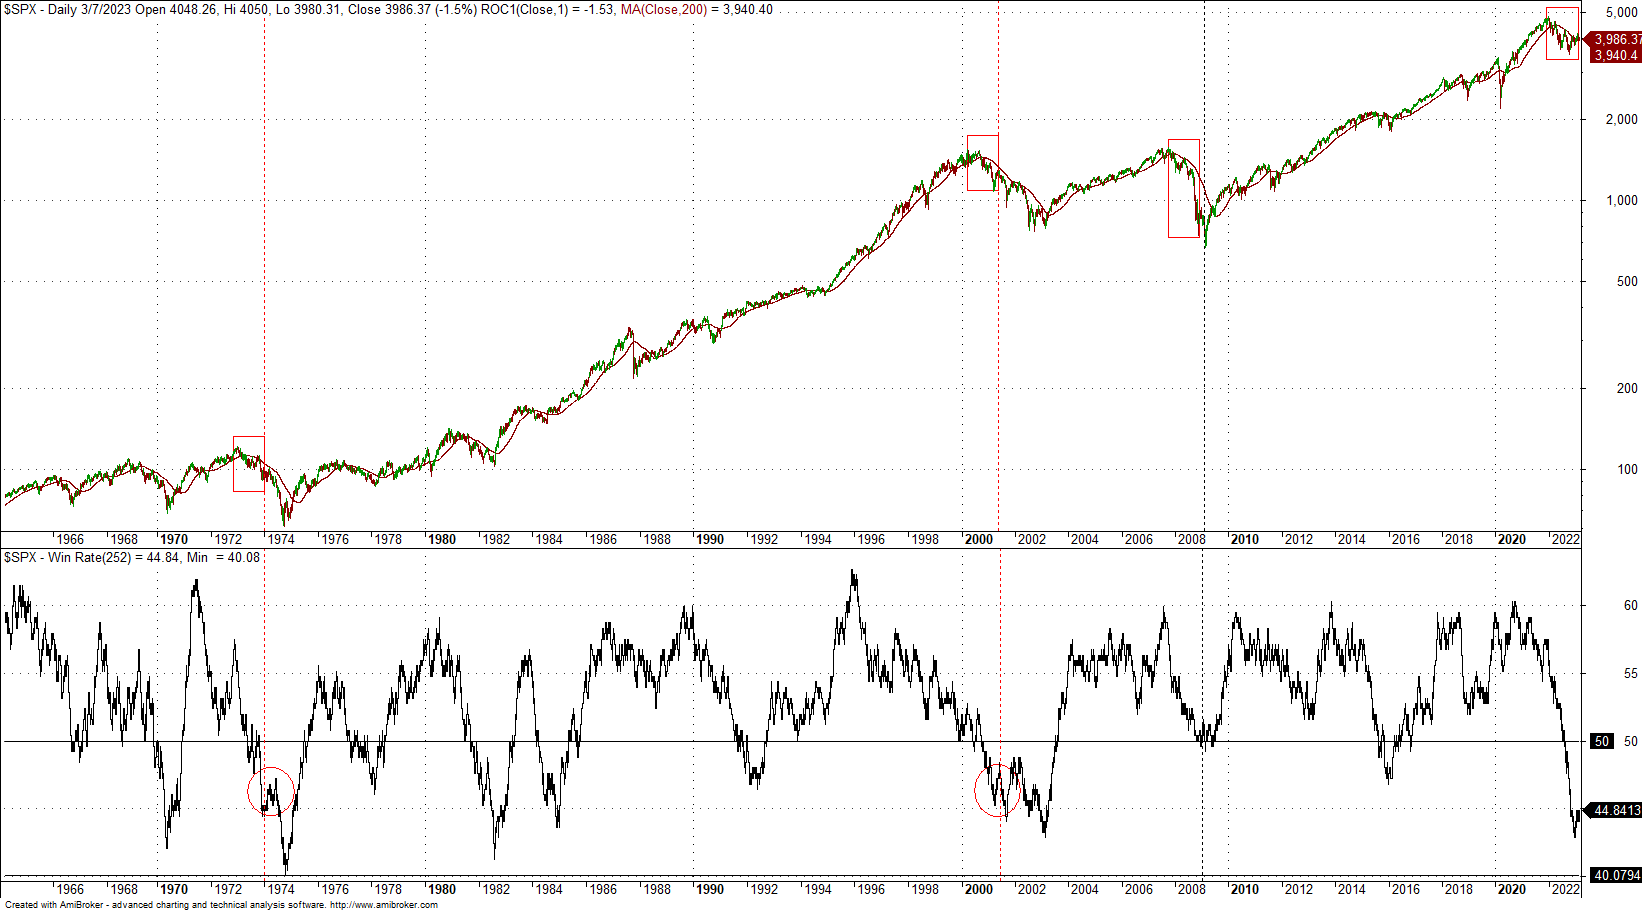
The 252-day win rate in the S&P 500 (percentage of up days in a 252-day lookback period) dropped to 42.9% on December 30, 2022, while the index was 20% below all-time highs. This indicator is a measure of the strength of the market, and during strong uptrends, it has reached near or above 60%. Values below 42% can be a sign that a bottom is forming, but the time it takes has been different in the past.
The red squares on the S&P 500 charts mark the 1970s, dot-com, the GFC, and the current downtrend in equities. The rectangles span 295 days. It may be seen that the GFC downtrend was almost over in that period, and there is no similarity. In addition, the win rate did not drop below 50%. The GFC bear market was due to special conditions, and the decline in equities was fast.
The current downtrend appears similar to the ones during the dot-com bear market and the 1970s bear market. If we think of the inflation rate as a variable, we could say that the current downtrend is similar to the one in the 1970s that ended in October 1974, with a maximum drop from previous highs of 48.2%. In addition to the 295 days in the rectangle, the drop continued for another 9 months. The win rate dropped to a low of about 40% after a brief bounce that ended in June of 1974.
We could also say that the current downtrend will keep going because it has similarities to both the bear markets of the 1970s and the dot-com crash. In that case, equities may decline for about 15 more months (on average), with a few more relief rallies along the way. So, this scenario says that we should expect the pressure on stocks to continue for at least another year.
Equities will recover at some point, but for most investors and traders, timing is important. For very long-term investors, timing is unimportant, and slow accumulation along downtrends pays off. Lack of sufficient samples forces making guesses and trying to match patterns for those with limited capital. Those who have virtually unlimited access to capital do not care much about this lack of samples, and a martingale strategy is the optimum one.
Disclaimer: No part of the analysis in this blog constitutes a trade recommendation. The past performance of any trading system or methodology is not necessarily indicative of future results. Read the full disclaimer here.
Charting and backtesting program: Amibroker. Data provider: Norgate Data
If you found this article interesting, you may follow this blog via RSS, Email, or Twitter.


