


In this article, we analyze the impact of dynamic stops on the performance of a trend-following strategy with futures contracts. Our backtests did not find any significant performance improvement.
We used Norgate data for our analysis. We highly recommend this data service (we do not have a referral arrangement with the company.)

Strategy Name: TFDLS
Timeframe: Daily (continuous back-adjusted contracts).
Markets: 23 futures contracts (We also tested the strategy with 39 futures contracts).
Strategy type: Trend-following based on breakouts, stop, and reverse.
Maximum positions: 23, long and/or short.
Position size: Based on stop-loss and maximum risk per position.
Stops-loss: Based on ATR.
Trade entry: All trades are executed at the open of the next bar.
Backtest range: 01/3/2000 –05/15/2023
The strategy is not optimized for the highest annualized return. The entries and exits are based on price breakouts. The breakout lookback period is not optimized but based on the popular length used by trend-following CTAs.
Static stop: It is calculated before entry based on ATR and stays constant until exit.
Dynamic stop: It is updated after every close based on ATR changes
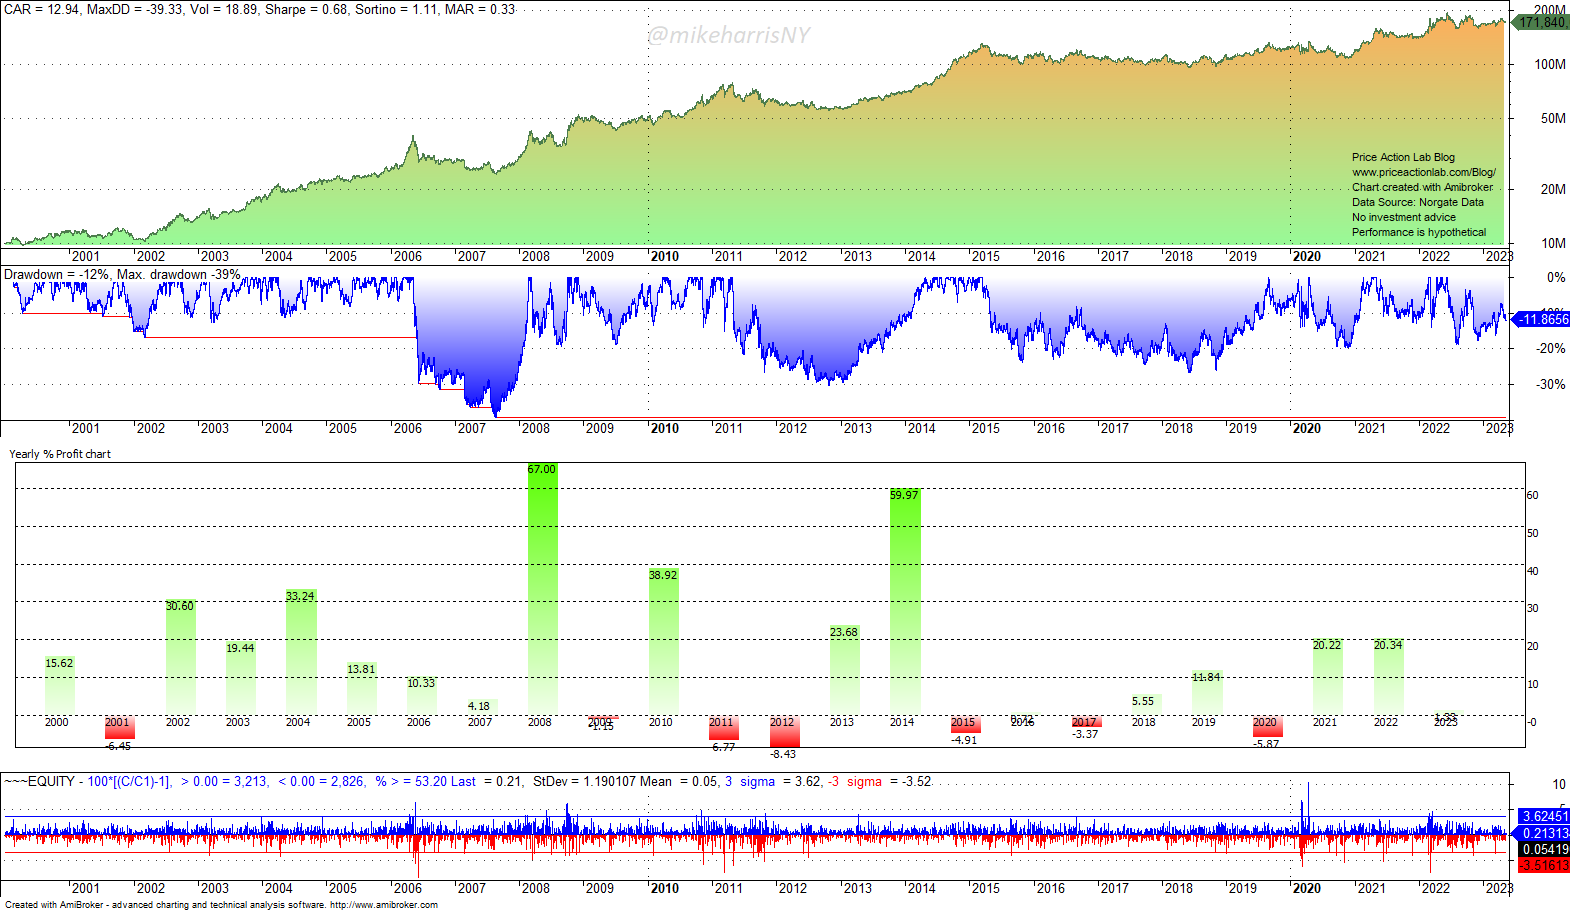
Static Stops: Equity Curve, Drawdown Profile, Yearly Returns, And Daily Returns Histogram
Dynamic Stops: Equity Curve, Drawdown Profile, Yearly Returns, And Daily Returns Histogram

Performance Summary and Comparison of Static and Dynamic Stops
| Static Stops | Dynamic Stops | |
| CAGR | 12.9% | 13.4% |
| MDD | -39.3% | -39.1% |
| VOLATILITY | 18.9% | 19.2% |
| SHARPE | 0.68 | 0.70 |
| TRADES | 1266 | 1266 |
| LONG TRADES | 662 | 638 |
| SHORT TRADES | 614 | 628 |
| AVERAGE TRADE | 14.9% | 15.1% |
| PROFIT FACTOR | 1.47 | 1.46 |
| WIN RATE | 21.6% | 21.6% |
| AVG. BARS IN TRADE | 78.7 | 79.9 |
| EXPOSURE | 59.4% | 59.9% |
| SKEWNESS | 3.95 | 3.96 |
Summary of the results
There is no significant difference in performance when transitioning from static to dynamic stops, even after the higher complexity. The gain in annualized return is 50 basis points and mostly due to turning a losing 2001 to flat. In our opinion, the high complexity of monitoring the trades and updating the stops is not justified for the small performance improvement, at least in the case of futures trading. We also increased the number of futures to 39, and we observed even less impact on performance. We suspect that as the number of markets increases, the impact of dynamic stops diminishes, due to smaller position sizes.
Rules of the strategy
The rules of the strategy TFDLS are available for sale. Contact us for details.
The Risks of Trend-Following Strategies
Trend-following strategies attempt to capture long-term market trends, also known as outlier trades. The implementation of stop-losses results in a low win rate, as the strategies exit with a loss until the onset of a trend. This style of trading is hard and could lead to a loss of discipline.
Trends and trend-following are not the same thing, and many confuse the two. A trend-following strategy will not identify trends where there are none. From 2004 to 2016, or 13 years, the annualized return of the top 20 CTAs was 2.4%. However, the dispersion in CTA returns is high, and it is not reflected in the averages. There is a high specific risk in choosing a CTA or a trend-following strategy.
Furthermore, proper execution of trend-following strategies with many futures contracts requires sufficient capitalization. For about 20 contracts, the approximate initial capital is probably around a million dollars. Otherwise, due to insufficient capital, a strategy could miss a few profitable trends, negatively impacting the Sharpe and MAR ratios.
Disclaimer: No part of the analysis in this blog constitutes a trade recommendation. The past performance of any trading system or methodology is not necessarily indicative of future results. Read the full disclaimer here.
Click here for a list of strategies.
Disclaimer: No part of the analysis in this blog constitutes a trade recommendation. The past performance of any trading system or methodology is not necessarily indicative of future results. Read the full disclaimer here.
Charting and backtesting program: Amibroker. Data provider: Norgate Data
If you found this article interesting, you may follow this blog via RSS or Email, or on Twitter


