


While quant traders and some evidence-based investors understand the methods and statistics used, marketing erodes their meaning by transforming them into elements used in narratives.
Marketing often uses terminology from statistics and strategy development to create artificial images to attack and sell a product. One marketing strategy is simple: find a term or statistic used by some competing methods, assign them a negative connotation, and then claim that the marketed strategy is better and therefore, superior.
Some years back, the term “prediction” was used in attacking timing strategies and selling trend-following methods. The objective of this article is not to prove if these methods are truly inferior to trend-following but to illustrate how the use of terms by marketing can erode their meaning.
The argument made was that trend-following does not make any predictions, and because predictions are bad and made by all sorts of charlatans, then all those other methods are also bad, because they attempt to predict, and trend-following does not because it “follows price”.
The above argument fails basic logic and quantitative tests. To start with, strategies based on quantitative methods do not try to predict the future in the same sense that charlatans do; these methods make forecasts about future returns and attach probabilities to them. Often these probabilities are not stated explicitly but are implicit.
More importantly, any trading or investing methods that generate market entry and exit signals make explicit or implicit forecasts about the direction of prices. Irrespectively of the method used, whether trend-following or mean-reversion, for example, a long position is an expectation or forecast, that prices will rise, and a long exit, or short position, is an expectation, or forecast, that prices will not rise further, or start to fall.
The method is irrelevant: any position in the market has an implicit or explicit forecast attached to it, otherwise, no action is taken. In the case of trend-following, this was illustrated quantitatively in the QUSMA blog with an elegant derivation.
However, the clash that ensued after the use of “prediction” by trend-following eroded the meaning of the term in the case of trading strategies, and even after extensive debates, some people still insist that trend-following does not make any “predictions”, or forecasts, but instead “follows prices”. Of course, trend-following follows prices until a forecast is made that following the prices is no longer profitable. In a stricter sense, at every price interval, trend-following updates its forecast of either continuation or reversal by evaluating the indicators used.
The relentless effort to make trend-following appear as a “prediction-free” method and the debate that ensued did harm to both trend-following and other market timing methods and more investors became buy and holders.
More recently, trend-following marketing has started attacking certain statistics because they do not have favorable values for this method. The Sharpe is under attack, while other statistics like skewness that have favorable values are offered as alternatives the investors should look at.
The flaw in the logic is that investors do not focus on any particular statistic but on a number of them, and the more sophisticated ones have procedures for evaluating strategies. However, due to the recent marketing efforts, both the Sharpe ratio and skewness have started losing their meaning because the attacks come from some people that are elevated to the status of expert in popular podcasts where there are no counter-arguments, but these individuals are let to make all sorts of sophisms the unsophisticated investors cannot evaluate properly.
Sharpe and skewness are two popular statistics. If a strategy has a low Sharpe but high skewness, it does not mean necessarily that it is better than a strategy with the same low Sharpe value but negative skewness. An example is managed futures. From 2010 to the end of 2018, managed futures had a lost decade even if they outperformed the S&P 500 total return during the dot com and GFC bear markets. Since 2000, the difference in total return is large, 183% for CTAs versus 335% for the S&P 500 total return.
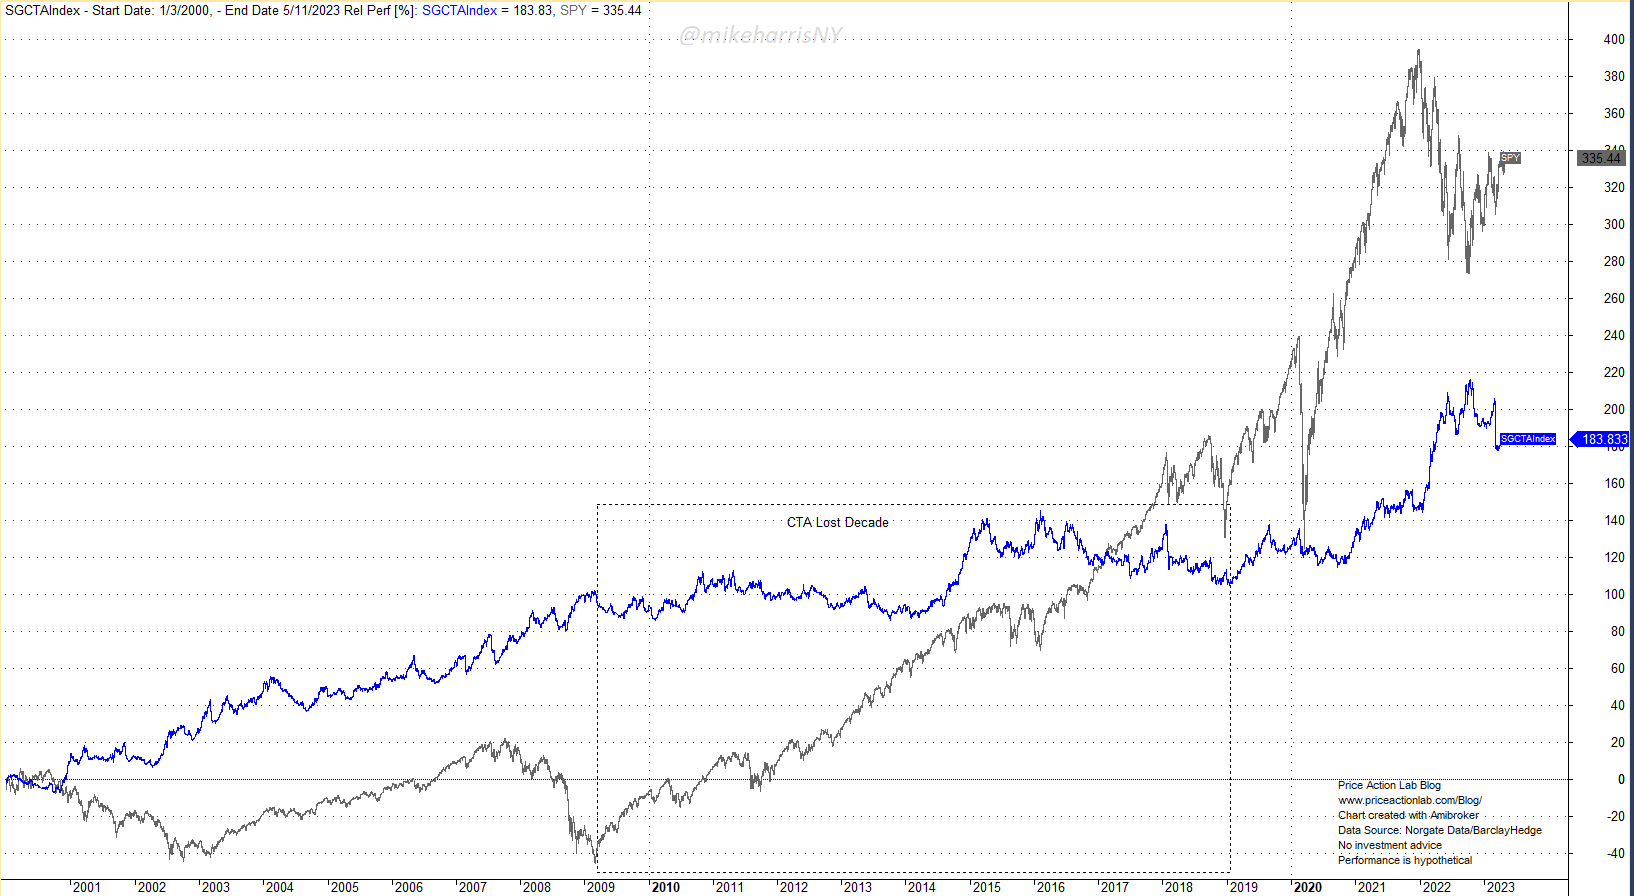
Relative performance of SG CTA Index and SPY ETF from 01/03/2000 to 05/11/2023
Despite the gross underperformance of managed futures CTAs since 2000, the marketing departments continue to use “high skewness” and the major advantage. However, skewness alone is not a very useful metric. A strategy can have long periods of underperformance and only a few good years can contribute to the high skewness. The overall distribution of returns matters. Similar considerations hold in the case of the Sharpe ratio: when considered in isolation, this metric may not be useful. A strategy with a 10% annualized return and 10% volatility has the same Sharpe ratio as a strategy with a 30% annualized return but 30% volatility. Investors will look at several metrics to make decisions but marketing isolates the metrics and targets then to create a narrative. In turn, in the case of most unsophisticated investors, these narratives erode the meaning of these useful metrics but also of the methods that generate them.
It is true, however, that nowadays it is very hard to differentiate between an astute quant and a marketing person using the same terminology, especially in podcasts, where the ultimate objective may be clicks and likes.
Premium Content
Online Books
Premium Articles
Systematic Market Signals
Trading Strategies
By subscribing you have immediate access to hundreds of articles. Premium Articles subscribers have immediate access to more than two hundred articles and All in One subscribers have access to all premium articles, books, premium insights, and market signals content.
Free Book
Subscribe for free notifications of new posts and updates from the Price Action Lab Blog and receive a PDF of the book “Profitability and Systematic Trading” (Wiley, 2008) free of charge.
Disclaimer: No part of the analysis in this blog constitutes a trade recommendation. The past performance of any trading system or methodology is not necessarily indicative of future results. Read the full disclaimer here.


