


There is no bull market yet, and mainstream media announcements are premature. I propose a more robust metric for deciding when a new bull market starts after a correction.
The mainstream financial media rushed last week to announce a new bull market. This was based on the S&P 500 gaining 20% from its 2022 lows.
Just as a hypothetical exercise, imagine a high-capitalization stock in the S&P 500 index rising 1000% for some reason after a large correction. The index could rise considerably and rebound by more than 20% some analysts use to declare the start of a new bull market. However, most of the stocks will remain near their correction lows. It may make no sense to use capitalization-weighted indexes to decide whether a new bull market has started. Below is a comparison of the market-capitalization weighted S&P 500 and the equal-weighted total return indexes from the bottom of October 12, 2022, to June 13, 2023.
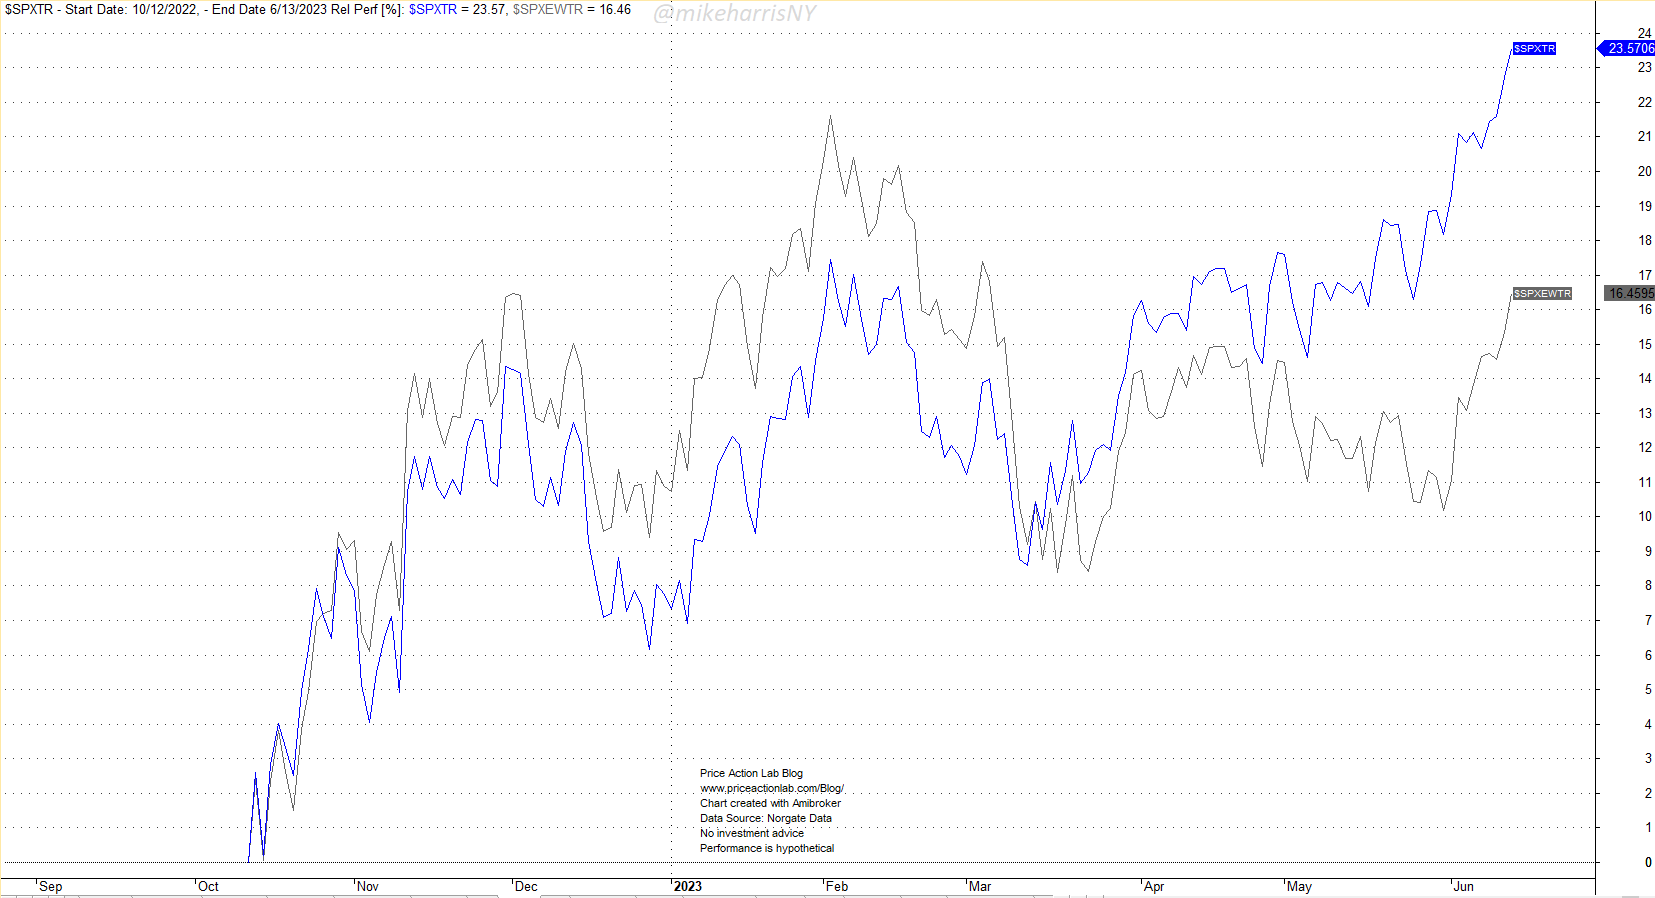
The S&P 500 total return has gained 23.6%, but the S&P 500 equal-weighted total return has gained only 16.5%.
Furthermore, 263 stocks are still more than 20% below their all-time highs, and the average drop of all stocks in the index is -26.3%. The median drop from all-time highs is -21.7%.
Below is the new measure I propose for deciding whether there is a new bull market after a large correction:
Median drop from all-time highs of S&P 500 constituents: > -20%
Although there may be objections, I believe this is a more reasonable measure that takes into account market breadth. Possibly, it has been proposed before.
Premium Content
By subscribing you have immediate access to hundreds of articles. Premium Articles subscribers have immediate access to more than two hundred articles and All in One subscribers have access to all premium articles, books, premium insights, and market signals content.
Free Book
Subscribe for free notifications of new posts and updates from the Price Action Lab Blog and receive a PDF of the book “Profitability and Systematic Trading” (Wiley, 2008) free of charge.
Specific disclaimer: This report includes charts that may reference price target levels determined by technical and/or quantitative analysis. No charts will be updated if the market condition changes affect the charts’ levels and/or any analysis based on them. All charts in this report are for informational purposes only. See the disclaimer for more information.
Disclaimer: No part of the analysis in this blog constitutes a trade recommendation. The past performance of any trading system or methodology is not necessarily indicative of future results. Read the full disclaimer here.
Charting and backtesting program: Amibroker. Data provider: Norgate Data
If you found this article interesting, you may follow this blog via RSS, Email, or Twitter.


