


It is a contradiction, but it appears to be the position of some CTAs, who do not like the Sharpe ratio but like their risk-adjusted returns.
Passive equity investors respond to those who dismiss the value of the Sharpe ratio by arguing that they only like the total returns. This is one reason their allocation to CTAs is zero or very small.
CTAs point to equities’ large drawdown and volatility in the last 23 years. They are right, but this is in essence an argument about risk-adjusted returns. Have the CTA risk-adjusted returns been better as compared to equities?
There are several parameters to consider, including the correlation of returns and any adjustments to the Sharpe ratio required to take these effects into account.
Another problem arises when CTAs refer to risk-adjusted returns and point to indexes that are ensembles of CTA programs. We know that the dispersion of the CTA returns included in these indexes has been high, probably above 20%. These indexes do not provide useful information about investing in CTAs, at least before ETFs came about.
Which CTA(s) then? The choice of program(s) to invest in would have affected the performance significantly in the last 23 years. Only recently have ETFs become available that attempt to track CTA ensemble performance, but it remains to be seen how successful they will be in the future. There is not enough data yet to confirm that these products track some indexes closely.
Let us start by saying that the objective of this article is not to attack CTAs, who have been doing an incredible and difficult job, but to present a balanced view on the “risk-adjusted returns” debate.
Below is a relative performance chart of SPY ETF (SPY2000), SG CTA Index, and the SG Trend index, from 01/03/2000 to 08/18/2023.
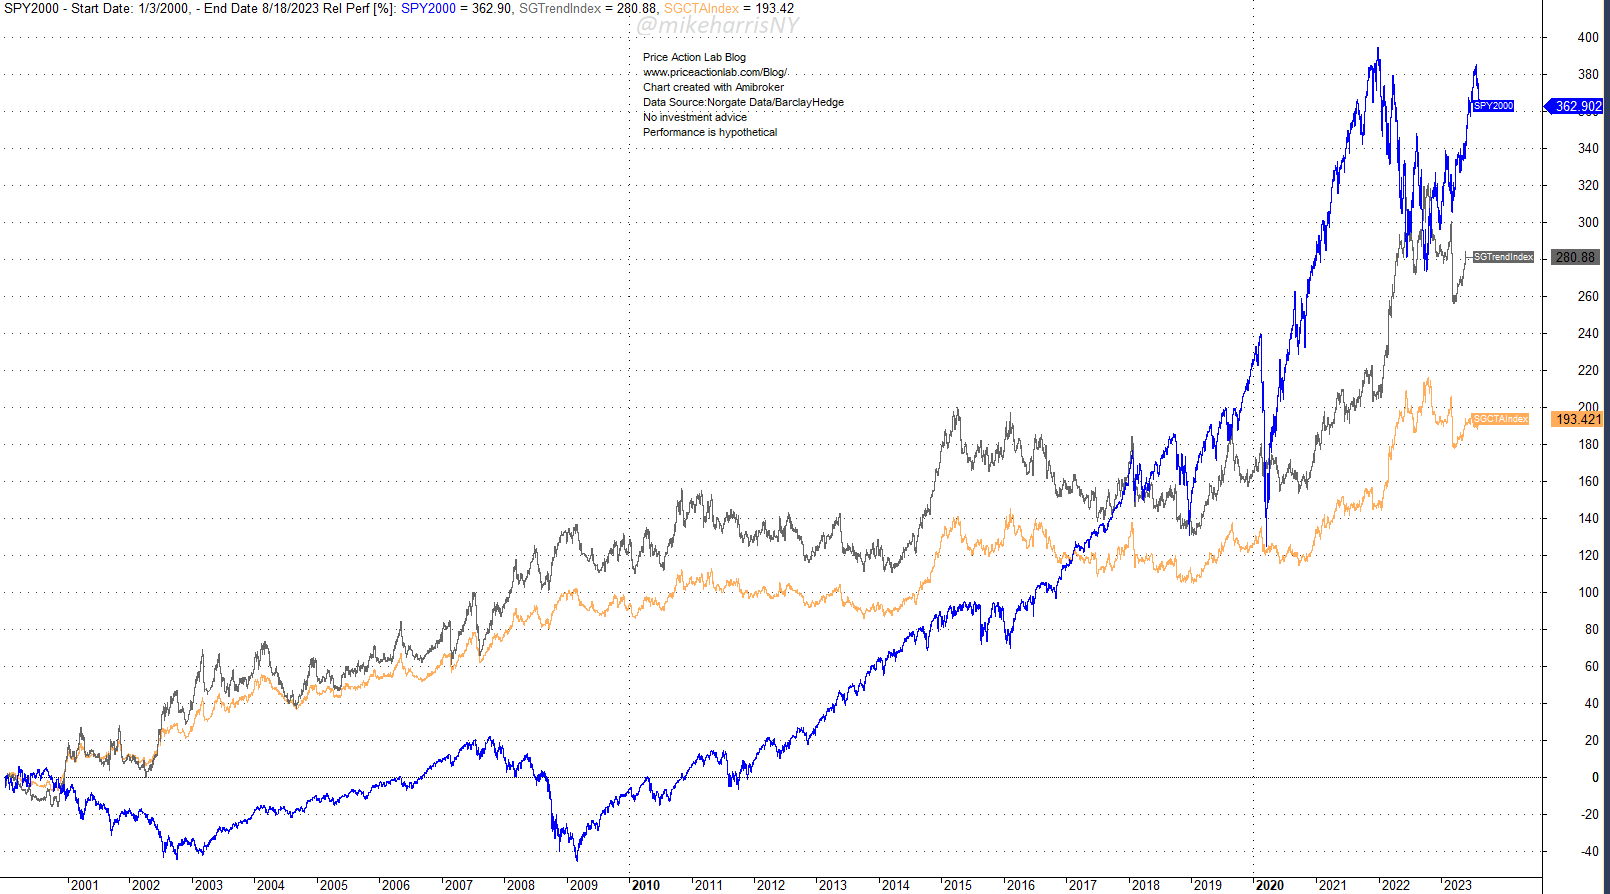
The difference in total return is significant: the SPY ETF has made 363% versus 280% for the SG Trend Index and only 193% for the SG CTA index.
“But we have offered convexity!” CTAs respond.
Most passive index investors have not heard about “convexity”, “skew”, “kurtosis”, etc. Understanding convexity as it relates to finance requires graduate studies.
“But equities had two drawdowns over 50%!”
This is true and may scare risk-averse investors. But these drawdowns present opportunities to some passive investors because they can martingale (average down) and multiply returns. The past two large drawdowns (2002 and 2009) were wealth-transfer periods from weak to strong hands. However, now we are talking about risk-adjusted returns, and we thought that most CTAs did not like the Sharpe ratio.
Talking about risk-adjusted returns without mentioning the Sharpe ratio, or even bashing it, is a fine marketing job. This is because, due to wide underperformance, CTAs have delivered a lower Sharpe ratio even at lower volatility.
“The Sharpe ratio punishes good equity volatility! It is a bad metric. We use the Sortino ratio.”
It is a good idea to punish both up-and-down volatility because we know volatility is mean-reverting. There have been studies that showed how the best-performing fund managers in some years underperformed during the next year.
Let us look at some data.
| SPY ETF | SG Trend Index | SG CTA Index | |
| Annualized Return | 6.7% | 5.9% | 4.7% |
| Max. Drawdown | -55.2% | -23.0% | -16.5% |
| Volatility | 19.7% | 13.9% | 8.9% |
| Sharpe ratio | 0.34 | 0.42 | 0.53 |
| Adj. Sharpe ratio* | 0.37 | 0.26 | 0.28 |
* Adjusted for correlation of returns. Data range: 01/03/2000 – 08/18/2023
After we account for correlation, the risk-adjusted performance of the SG indexes is much lower than that of the SPY ETF, which has a negative return correlation.
Risk-averse investors could find the low volatility of the SG CTA index appealing, but not those who are looking for absolute returns due to a lower annualized return by 200 basis points.
The future is uncertain, and equities may underperform CTAs. Or, CTAs may have another lost decade. Some CTAs may provide spectacular returns, while others could have dismal results. No one knows the future, but talking about risk-adjusting returns but dismissing the value of the Sharpe ratio, which measures risk-adjusted returns, is a contradiction.
Free Book
Get a free PDF of the book “Profitability and Systematic Trading” (Wiley, 2008) by subscribing to the Price Action Lab blog’s free email notifications of new posts and updates.
Disclaimer: No part of the analysis in this blog constitutes a trade recommendation. The past performance of any trading system or methodology is not necessarily indicative of future results. Read the full disclaimer here.
Charting and backtesting program: Amibroker. Data provider: Norgate Data
If you found this article interesting, you may follow this blog via RSS, Email, or Twitter


