


Market summary, open positions, new signals, and performance of six trading strategies with weekly rebalancing. Tactical asset allocation, mean-reversion, cross-sectional momentum, commodity trend-following, and equity long-short. Access the full report with a Market Signals or All-in-One subscription.
We wish you and your family a Happy New Year 2024!
Thank you for being a subscriber to the Price Action Lab Blog!
We are so honored to have your time, attention, and support.
Announcements
1. Starting with this report, the DMSRM strategy replaces the TFLSW commodity ETF strategy. In addition, there are some changes in the TFD3W strategy, and the new name is TFD3M. In the last report, we provided details for initializing the positions of the DMSRM strategy for next year.
2. This week’s report includes a performance summary for the last two years.
3. The Hybrid Asset Allocation monthly signals are free for Market Signals and All in One subscribers.
Report Contents
1. Market Recap and Comments
2. 2023 Recap and Ensemble Performance
3. Positions and Performance of Strategies
4. Signal Summary for Next Week
1. Market Recap and Comments (December 26–December 29, 2023)
Stocks gained for the ninth week in a row due to expectations of multiple rate cuts next year. All assets gained on the back of a falling US dollar, except high-yield bonds, which were slightly down, and commodities. The stock market finished the year overbought (strong momentum). Three weeks ago, I wrote:
There is a sense that investors’ optimism is not justified, and there will be a short-term correction for a more realistic alignment with fundamentals. However, the correction may not come until next year.
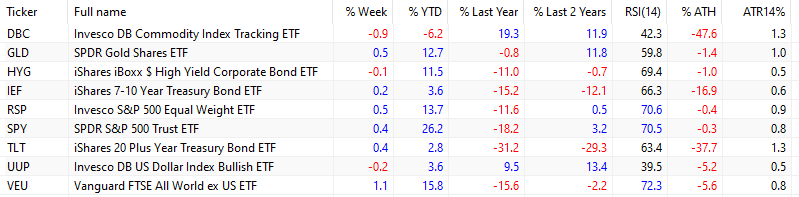
For the last week of the year, large-cap stocks (SPY) gained 0.4%, and the equal-weight S&P 500 ETF (RSP) rose 0.5%. International stocks (VEU) were up 1.1%. Long-duration bonds (TLT) rose 0.4%.
Commodities (DBC) fell 0.9%, primarily due to losses in crude oil, silver, and a mixed performance in grains. Gold (GLD) added 0.5% on the back of a falling US dollar index (UUP, -0.2%).
Since the start of 2022, the TLT ETF is down 29.3%, while international stocks (VEU) have lost 2.2%. The SPY ETF is up 3.2% in the same period. Commodities (DBC) and the US dollar index (UUP) are up 11.9% and 13.4%, respectively, since last year. Note that in the same period, gold (GLD) is up 11.8%.
The TLT ETF is down 37.7% from its all-time highs, while the SPY ETF is down only 0.3%. Stocks recovered from the 2022 correction, while long-duration bonds are still in a deep drawdown. Although the rebound was spectacular, in reality, stocks only managed to recover the losses of 2022. In 2022, the S&P 500 index fell 25.4% from its all-time closing high. The Sharpe ratio of the S&P 500 index has been equal to 0 in the last two years.
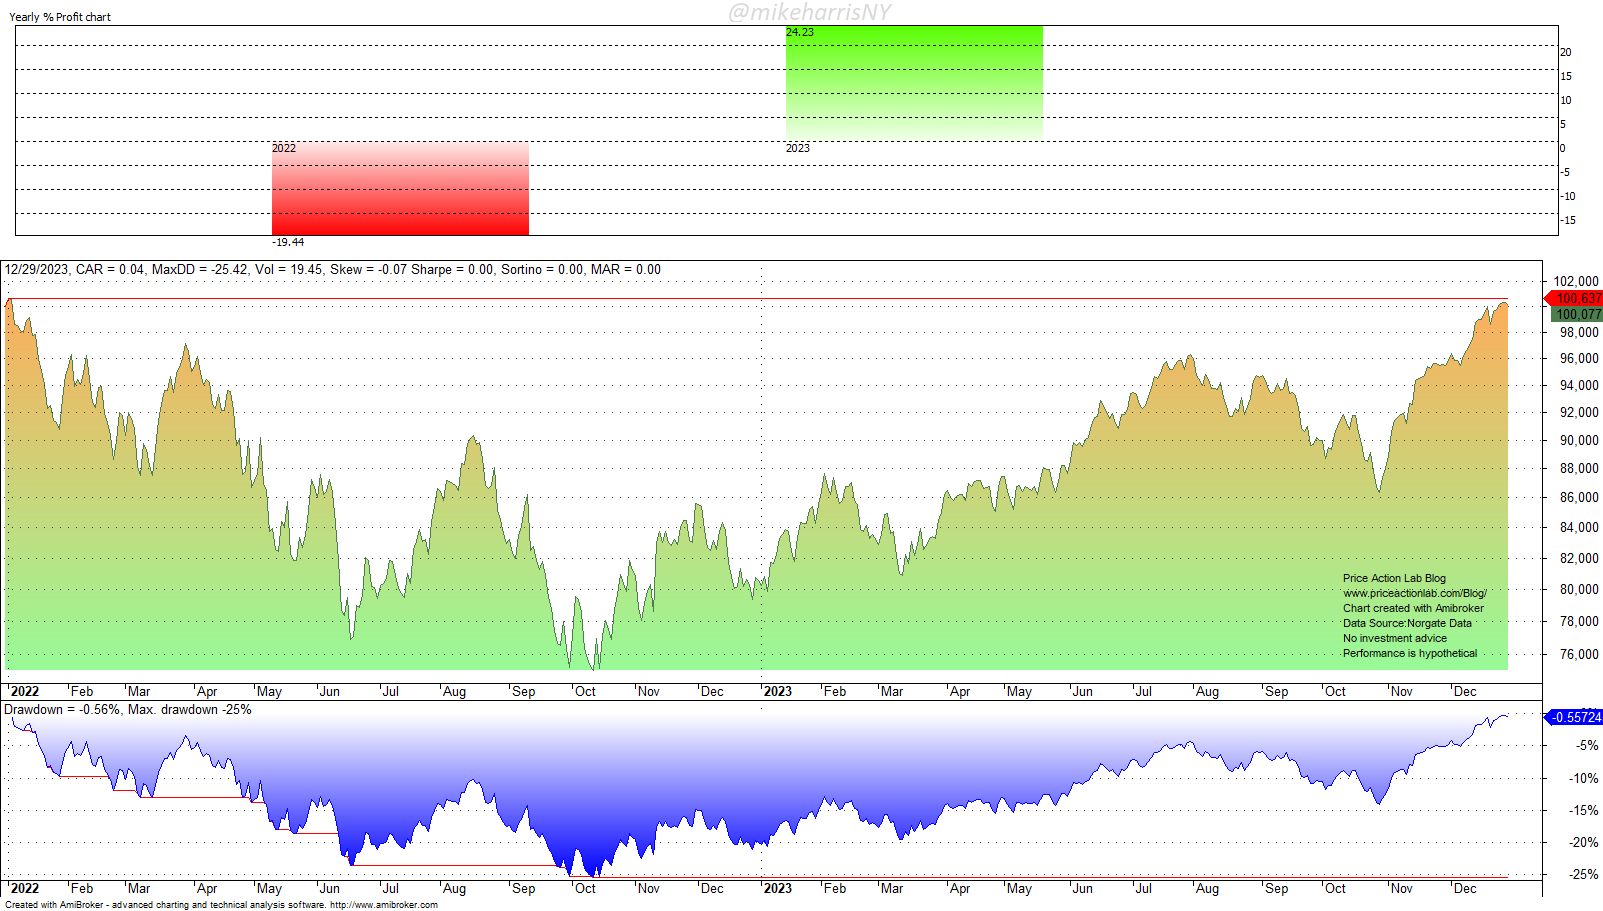
Performance of S&P 500: 2022-2023
The NASDAQ-100 had a spectacular run in 2023, also recovering from 2022 losses.
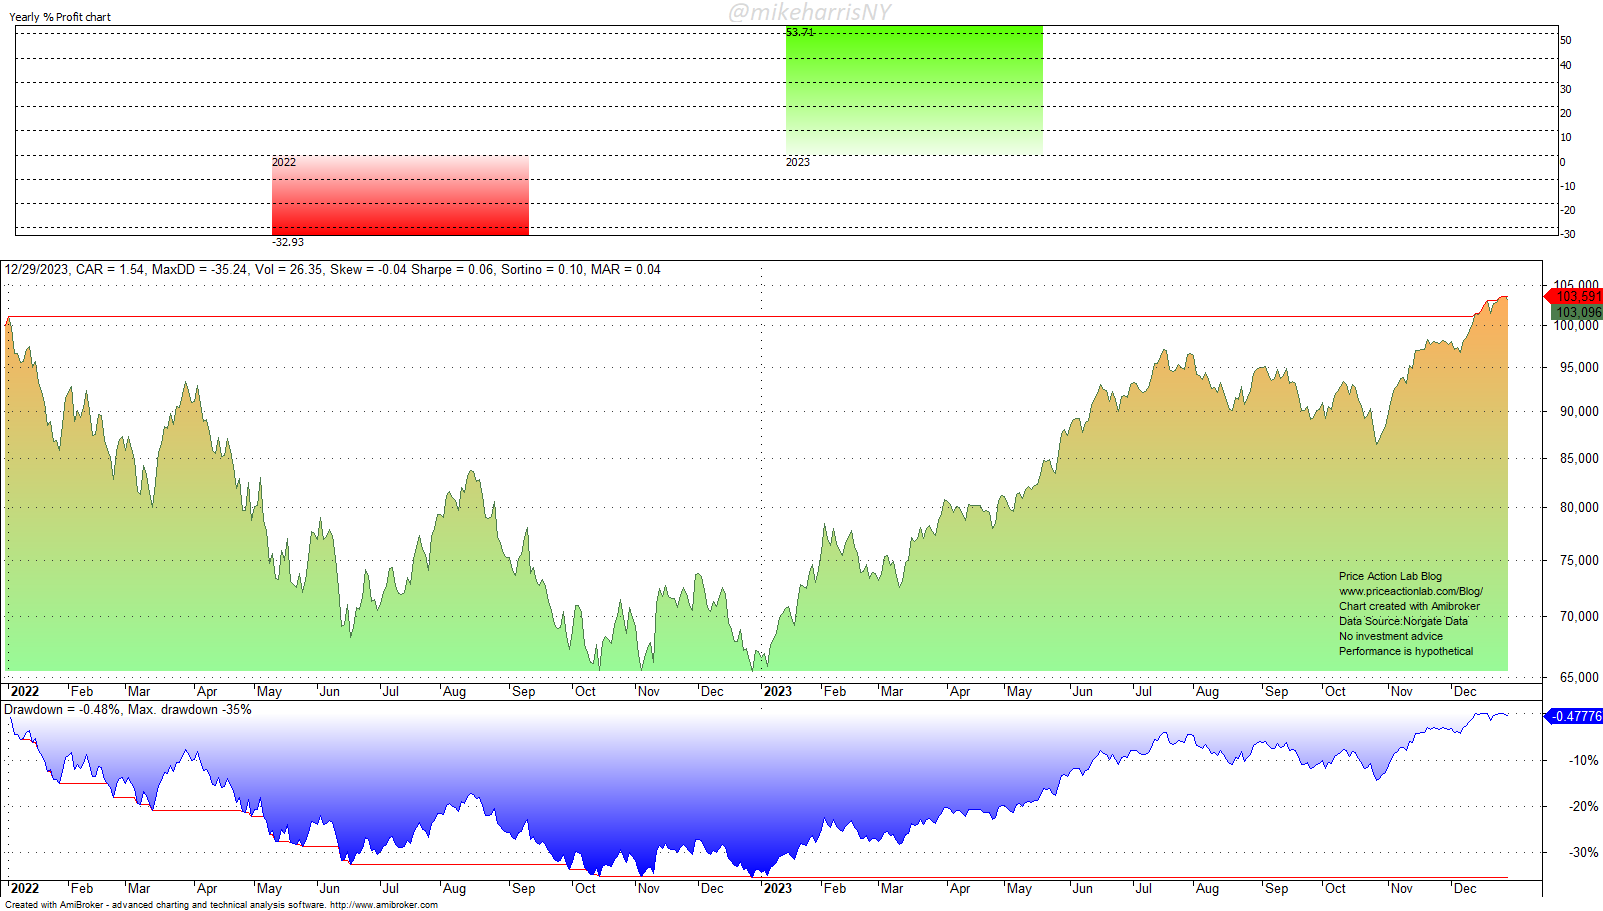
Performance of NASDAQ-100: 2022-2023
After two years, stocks are back where they ended in 2021. Is this a reason to celebrate? For some, it is; for others, it is not. The stock market will start in 2024 in highly overbought territory. Investors and traders will pay close attention to economic and geopolitical developments. The rising public debt may become a source of risk in the near future. See this article for an analysis and some thoughts.
2. 2023 Recap and Ensemble Performance
Access the full report with a Market Signals or All-in-One subscription. By subscribing, you have immediate access to hundreds of articles. Market Signals subscribers have immediate access to hybrid asset allocation and dynamic momentum monthly signals and more than two hundred articles in the Premium Education section, and All in One subscribers have access to all premium content (except daily mean-reversion signals.)
|
This post is for paid subscribers
Already a subscriber? Sign in |
Charting and backtesting program: Amibroker. Data provider: Norgate Data
Disclaimer: The Premium and Weekly Signals are provided for informational purposes only and do not constitute investment advice. We do not warrant the accuracy, completeness, fitness, or timeliness for any particular purposes of the Premium and Weekly Signals. Under no circumstances should the Premium or Weekly Signals be treated as financial advice. The author of this website is not a registered financial adviser. Before subscribing, please read our Disclaimer and Terms and Conditions.
Copyright notice: Any unauthorized copy, reproduction, distribution, publication, display, modification, or transmission of any part of this report is strictly prohibited without prior written permission.


