


We look at year-end seasonality in stocks, bonds, gold, and the US dollar, and specifically the performance of these markets in the last trading week after Christmas.
We buy at the close of the last trading day before the Christmas holiday and exit at the close of the last trading day of the year. We consider the following markets: the S&P 500 index, the S&P US Treasury Bond Total Return Index, the US Dollar Index, and the spot gold (London PM Fix). After looking at each market, there will be a summary table with win rates and average trade gains.
S&P 500 Index
This is the most interesting end-year seasonality chart because of the large gain in 2018.
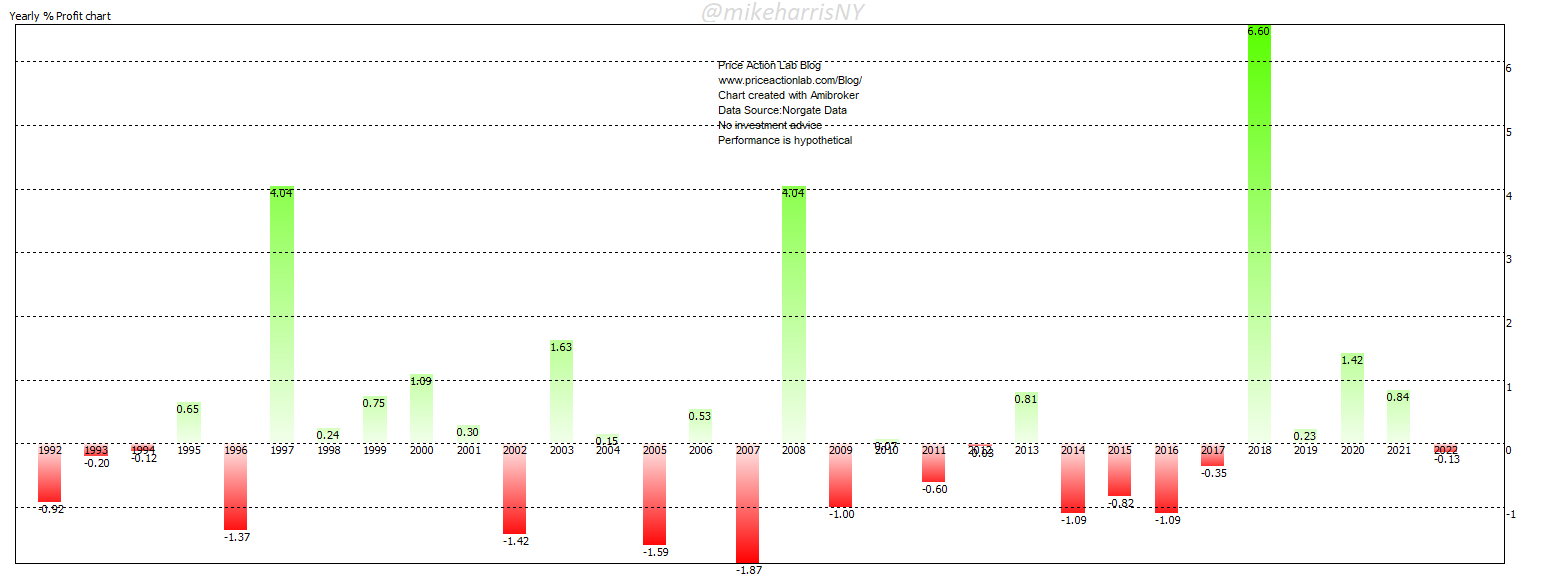
The reason the above chart is interesting is because 2018 had the largest loss in December.
The index lost 9% in December 2018, despite a gain of 6.6% in the last trading week of the year. Therefore, the seasonal gain was due to a rebound from a large monthly loss. The index ended 2018 with a loss of 6.2%.
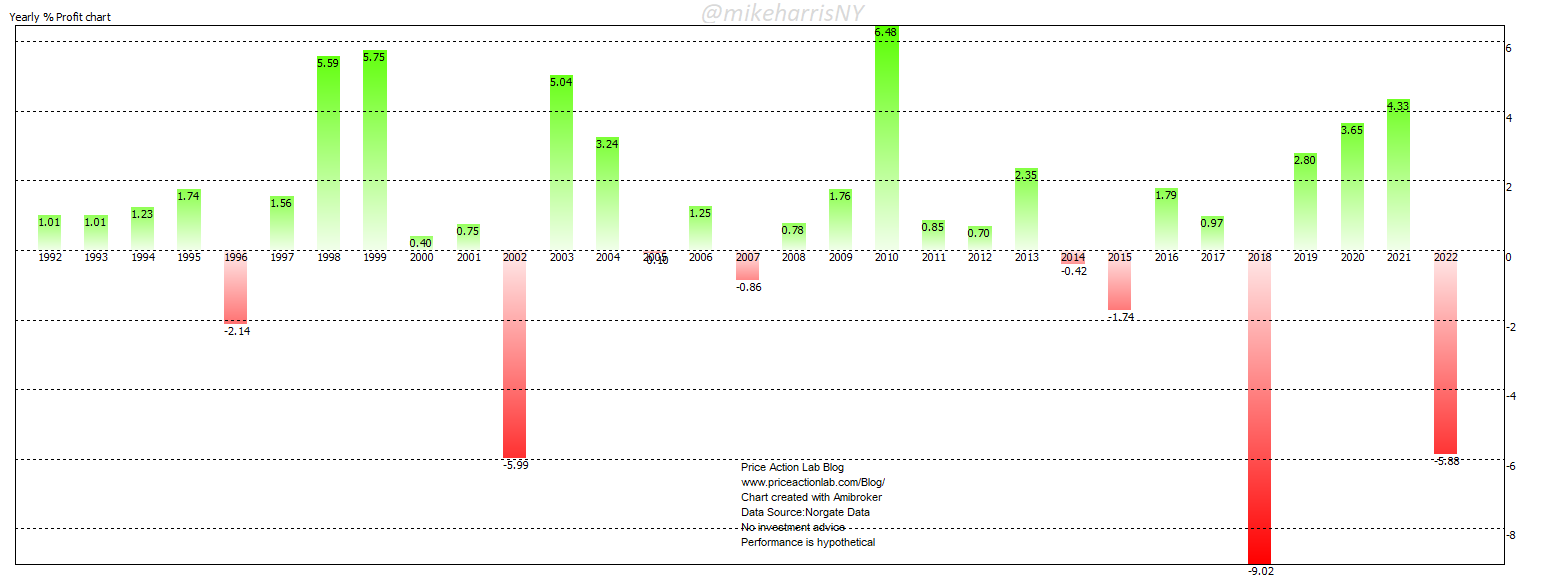
S&P US Treasury Bond Total Return Index
Last year had the worst performance for the last trading week of the year, with a loss of about 0.7%. The reason was high inflation and high interest rates.
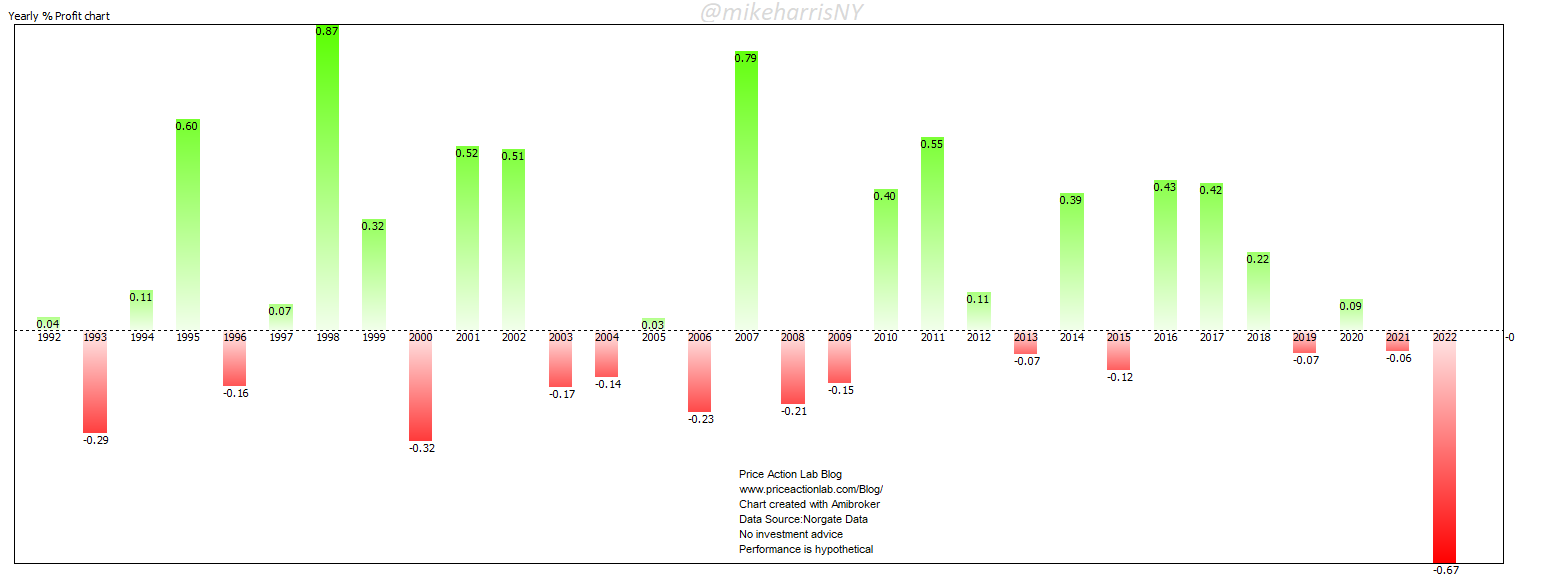
US Dollar Index
The US dollar index has exhibited strong down seasonality for the last trading week of the year. Details are in the table at the end.
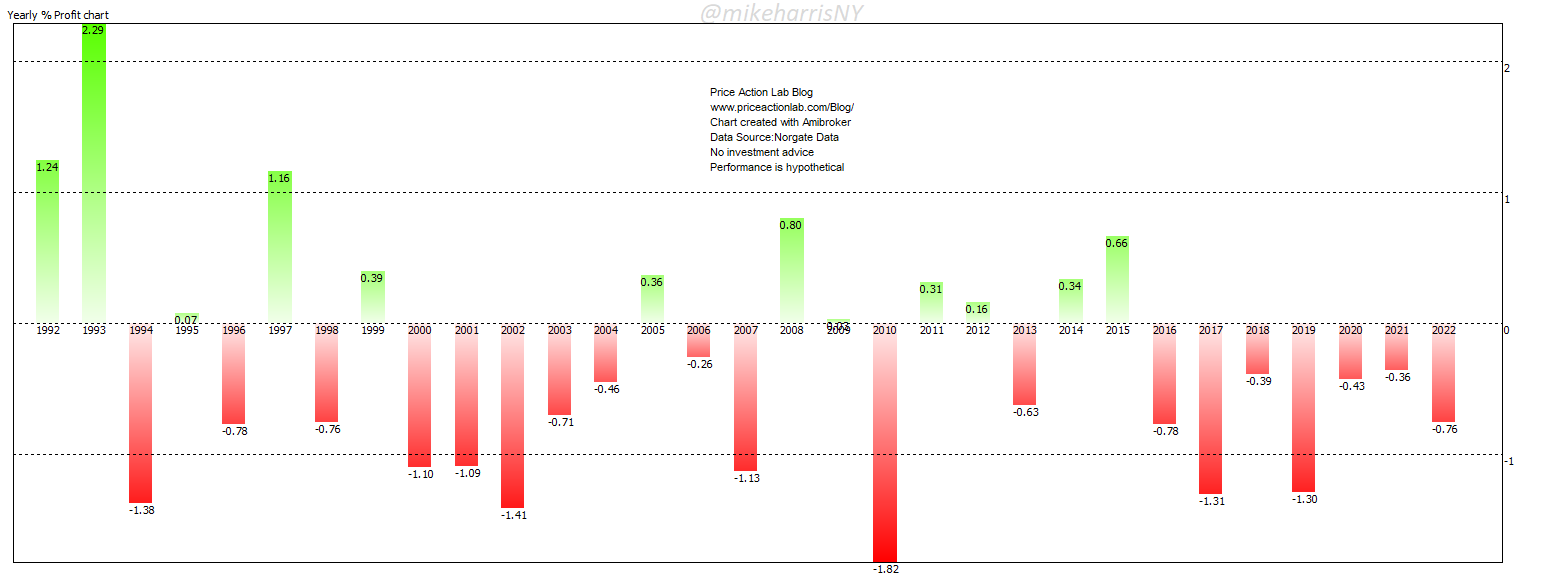
Spot gold (London PM Fix)
Gold exhibits the strongest seasonality for long trades during the last week of the year.
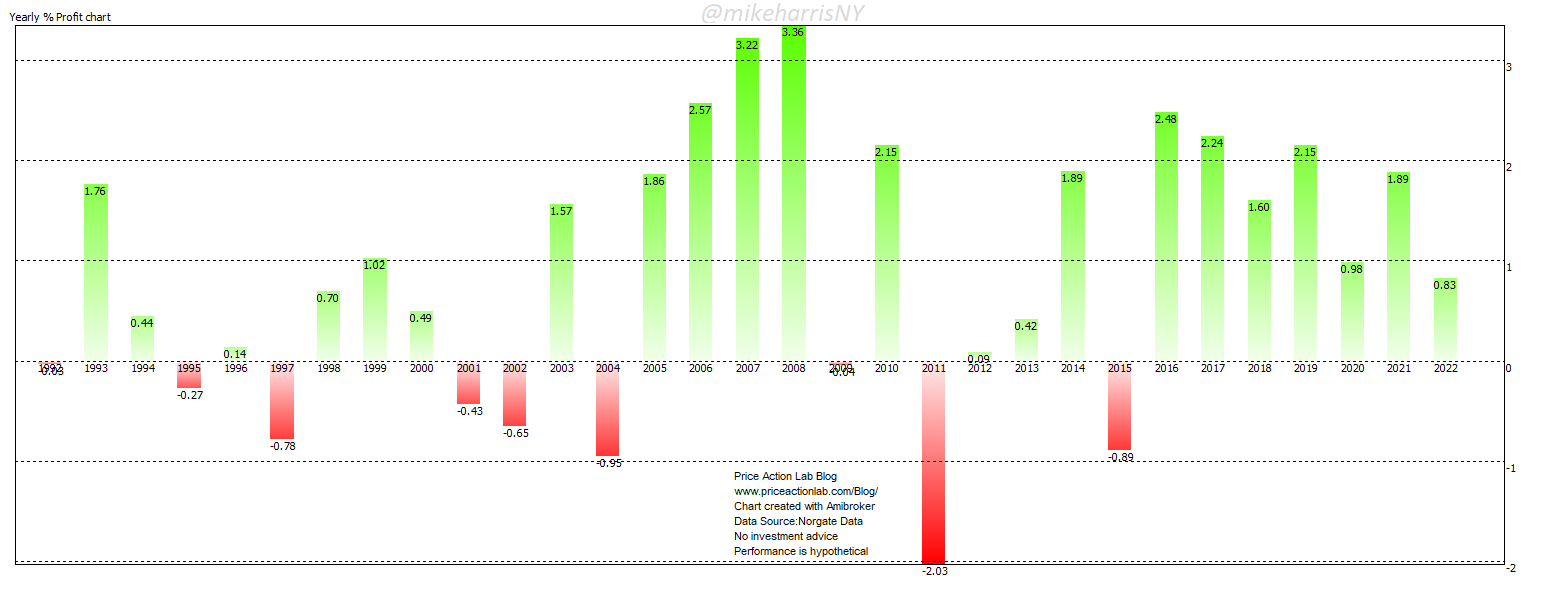
The best performance was in 2008 with a 3.4% gain, and the worst was in 2011 with a 2% loss. Since 2016, gold has been up during the last trading week of the year.
Summary
The table below shows the win rate and average trade for the last trading week of the year from 1992 to 2022, or for a period of 31 years.
| Win rate | Average Trade % | |
| S&P 500 Index | 51.6% | +0.4 |
| S&P US Treasury Bond Total Return Index | 58.1% | +0.1 |
| US Dollar index | 38.7% | -0.3 |
| Spot gold (London PM Fix) | 71% | +0.9 |
Conclusion
Gold has quite strong seasonality for long trades, and the US dollar index has strong seasonality for short trades.
Caveat emptor: Ensemble averages and win rates (proportions) do not provide good measures of the probability of winning in the time domain. For example, even if the probability of winning is 90%, there is still a 10% probability of losing. Therefore, the statistics provided in this article are not forecasts.
Disclaimer: No part of the analysis in this blog constitutes a trade recommendation. The past performance of any trading system or methodology is not necessarily indicative of future results. Read the full disclaimer here.
Charting and backtesting program: Amibroker. Data provider: Norgate Data
If you found this article interesting, you may follow this blog via RSS, Email, or Twitter.


