


The weekly market reports include a stock market forecast and an analysis of capital markets. Access to the full report requires a Premium Articles or All-in-One subscription.
Included in this weekly market report:
- “The best of all possible worlds.”
- The volatility has been crushed.
- A new autocorrelation regime?
- CRB index-CPI correlation.
Weekly Summary (January 22–January 26, 2024)
- U.S. stocks were up on increased optimism about the economy.
- Bond yields rose, and bond prices fell due to rate uncertainty.
- Crude oil surged along with rising tensions in the Middle East.
- The US dollar was up on the back of rising bond yields.
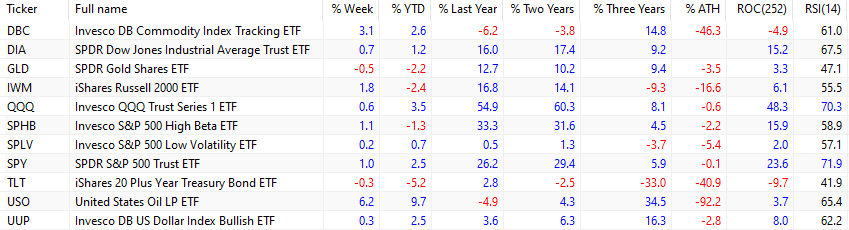
After tensions rose in the Middle East, the spot price of crude oil (USO) surged by 6.5%. The DBC ETF gained 3.1% due to its high correlation with crude oil. Despite the rising geopolitical tensions, gold (GLD) lost 0.5% for the week.
Large-cap stocks (SPY), tech stocks (QQQ), and small caps (IWM) were up 1%, 0.6%, and 1.8%, respectively, on the week. High beta large caps (SPHB) rose more than low volatility large caps (SPLV), 1.1% versus 0.2%, respectively, due to the risk-on environment.
Long-duration bonds (TLT) were down 0.3%. Despite falling inflation, the bond market rebound stalled due to a lower probability of a March rate cut arising from solid growth and low unemployment. The US dollar (UUP) gained 0.3%.
Since January 2022, large-caps (SPY) have been up 5.9%, but with a maximum drawdown of 24.5%. Gold (GLD) has outperformed large-cap stocks in the same period with a gain of 9.4%.
“The best of all possible worlds”
In his work Theodicy (1710), the German philosopher Gottfried Leibniz coined the term “the best of all possible worlds.” He argued that, despite all its problems, this is the best world possible. Philosophers referred to this as “the doctrine of optimism,” and that sparked a heated and ongoing debate. Voltaire, a French philosopher, rejected and mocked the doctrine of optimism in his famous 1757 novel Candide. For Voltaire, the optimism was ridiculous, since the world had just too many problems.
Nowadays, there is a similar debate about the US economy and the equity markets. Some economists and market analysts point to the recent data and claim this is the best macroeconomic environment: solid growth, low unemployment, and falling inflation. Some other economists and market analysts reject this thesis; they point out problems such as large deficits, rising public debt, political uncertainty, and geopolitical turmoil.
The current optimism about the economy is reflected in the “yield curve inversion conundrum.” Despite a persistent inversion of 10-year and 3-month yields, there has not been a recession or a bear market.
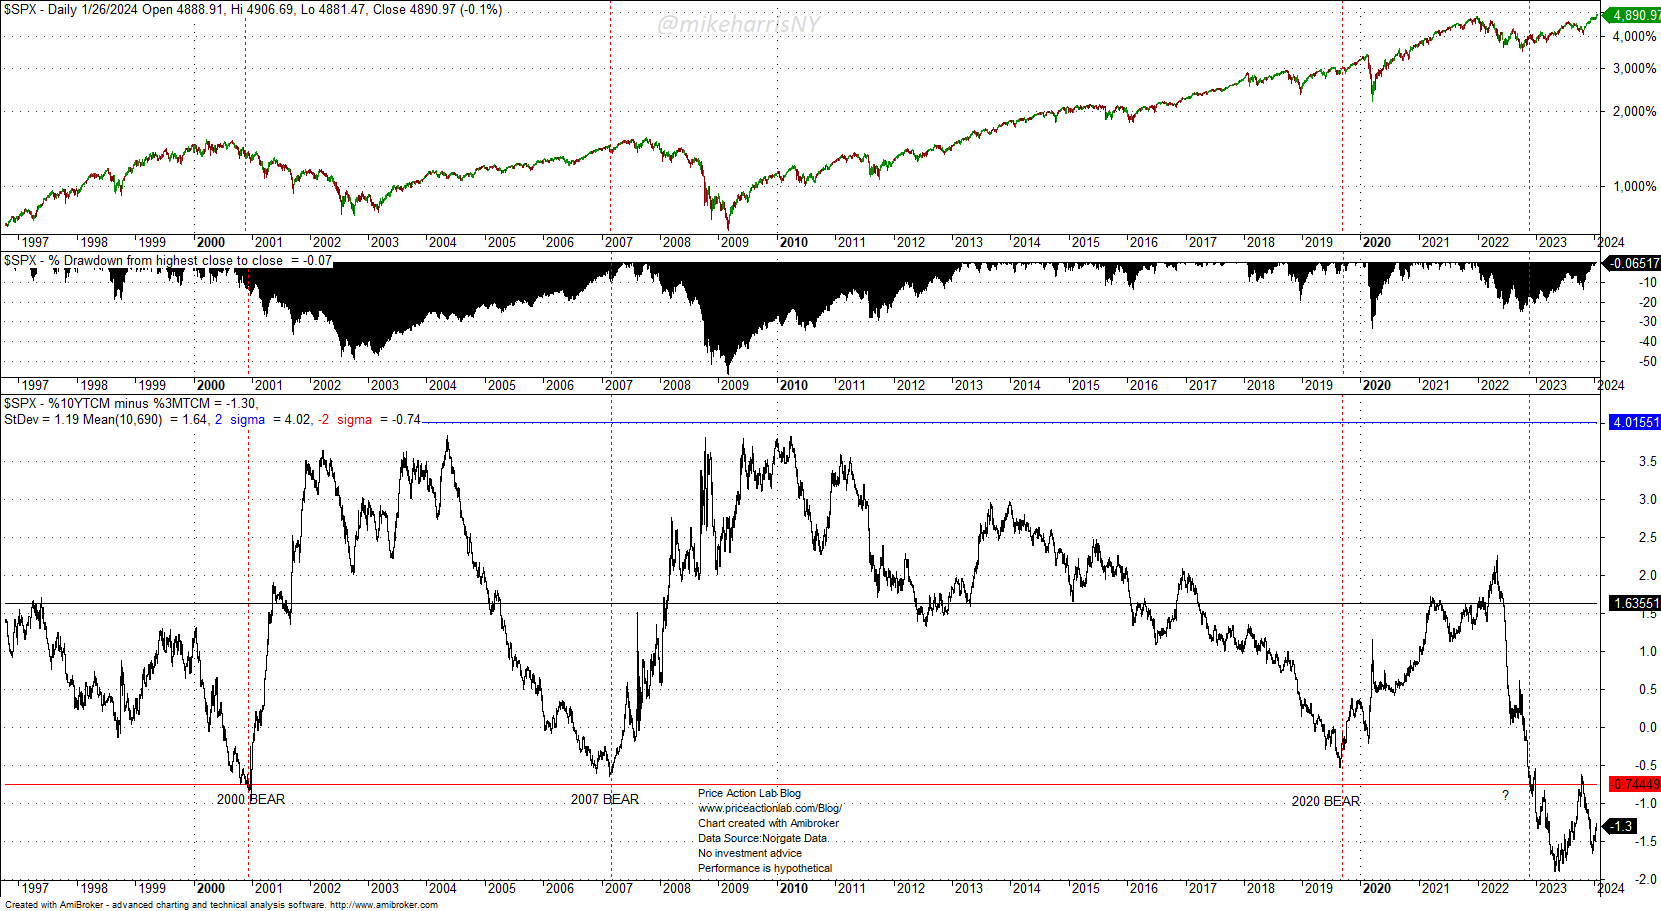
Yield curve inversion and S&P 500 index. Source: Price Action Lab Blog Data: Norgate Data
In all three recent periods after an inversion, in 2000, 2007, and 2020, there was a bear market, as marked on the chart above. In the current inversion regime, the stock market has rallied and there is no recession, according to the data.
Possible explanations include the possibility that the data is not correct. A prevailing thesis is that this is a new regime that has no relation to past ones due to technological and financial innovation, i.e., this is “the best of all possible macroeconomic environments.” What remains is to get that bond market rally going to declare final victory.
Is a recession coming? Will equities enter a bear market? Or is this the start of a new bull market, as the optimists assert?
“No one knows” is not a good answer. Probably someone knows. Someone always knows, and this is a famous result in formal logic we will discuss in a future report. Any attempt to solve the current puzzle is an exercise in futility because the system is just too complex. Complexity is not an excuse; it is the true nature of the system. When the system is too complex, the confidence intervals in forecasting probabilities are too wide, and the results are unstable; all probabilities arise from a fair coin toss. Technical traders know that even a fair coin toss can be profitable if the payoff is high. Therefore, a good indicator might provide better chances than macroeconomic exercises in futility. For most people, those who admit they do not know, a historically proven method of forecasting is “the best of all possible methods.”
Stock Market Forecast
A proprietary model generates the forecast. The model’s accuracy has been close to 100%. The model generates well-defined long entry and exit signals for SPY ETF. The model does not attempt to forecast exact tops and bottoms. The objective is to minimize losses due to large corrections and maximize gains in uptrends.
Access the full report with a Premium Articles or All-in-One subscription. By subscribing, you have immediate access to hundreds of articles. Premium Articles subscribers have immediate access to more than two hundred articles, and All in One subscribers have access to all premium content except daily mean-reversion signals.
|
This post is for paid subscribers
Already a subscriber? Sign in |
Specific disclaimer: This report includes charts that may reference price levels determined by technical and/or quantitative analysis. No charts will be updated if market conditions change the price levels or any analysis based on them. All charts in this report are for informational purposes only. See the disclaimer for more information.
Disclaimer: No part of the analysis in this blog constitutes a trade recommendation. The past performance of any trading system or methodology is not necessarily indicative of future results. Read the full disclaimer here.
Charting and backtesting program: Amibroker. Data provider: Norgate Data
If you found this article interesting, you may follow this blog via RSS, Email, or Twitter.


