


Calculating statistics for highly overbought stocks requires a historical series with delistings for major indexes. Here are some examples using Norgate Data.
On Thursday, February 15, 2024, the 14-day RSI of Super Micro Computer, Inc. (SMCI) reached 96.79 due to a parabolic uptrend.
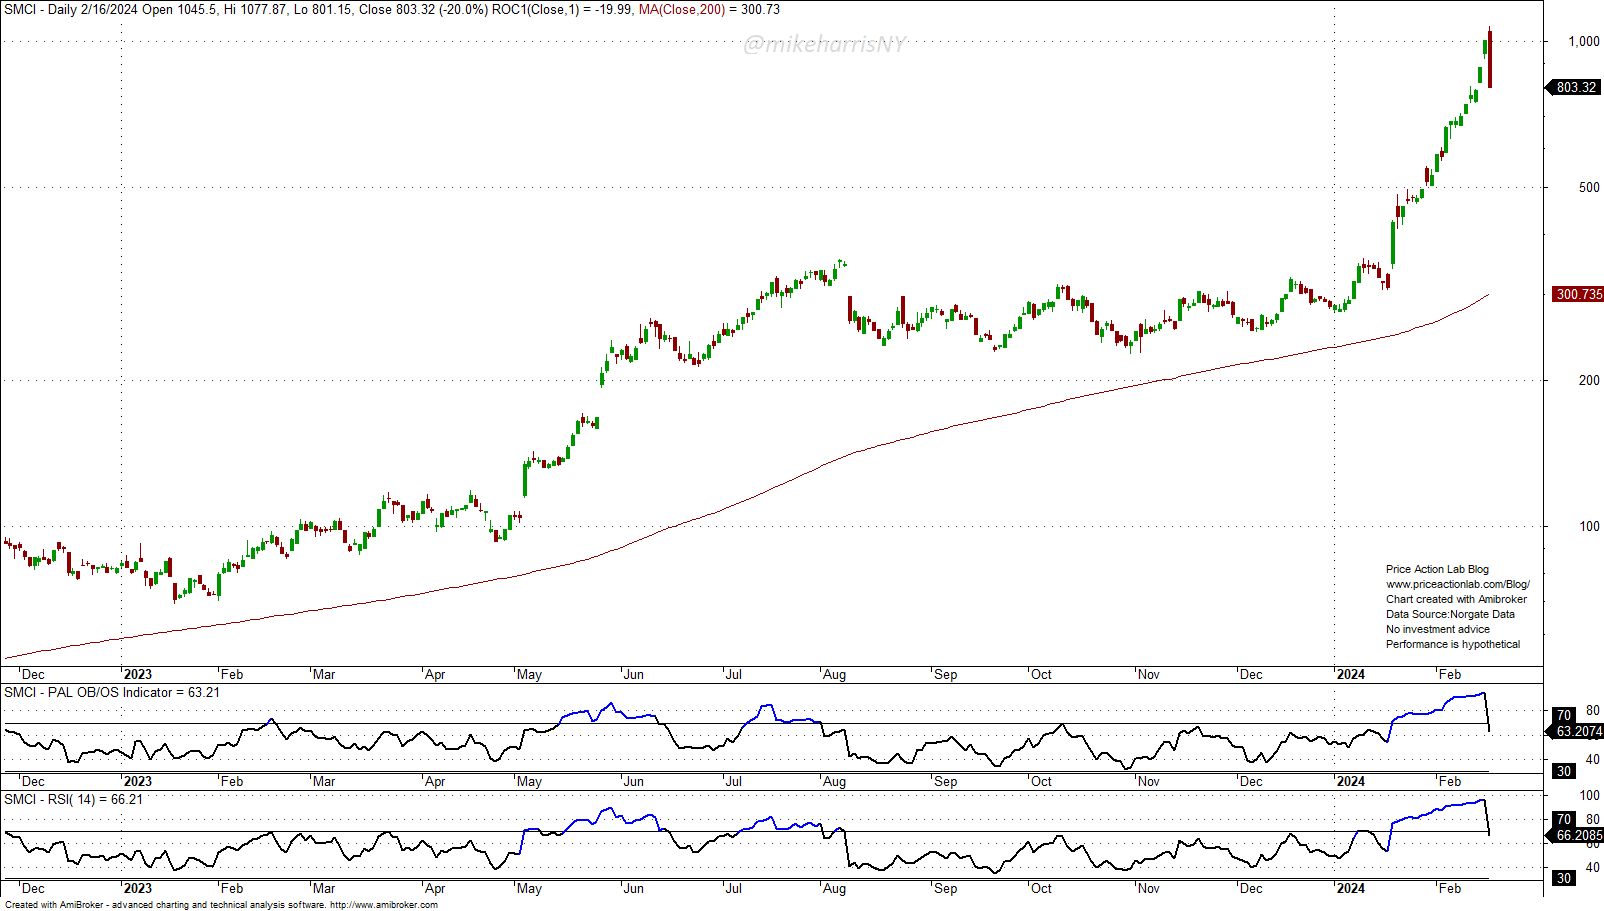
There were numerous posts on financial social media about the high 14-day RSI and claims that this high value was only reached in the past in the case of Game Stop, Inc. during the meme stock frenzy two years ago. Note that the following day, SMCI plunged 20%.
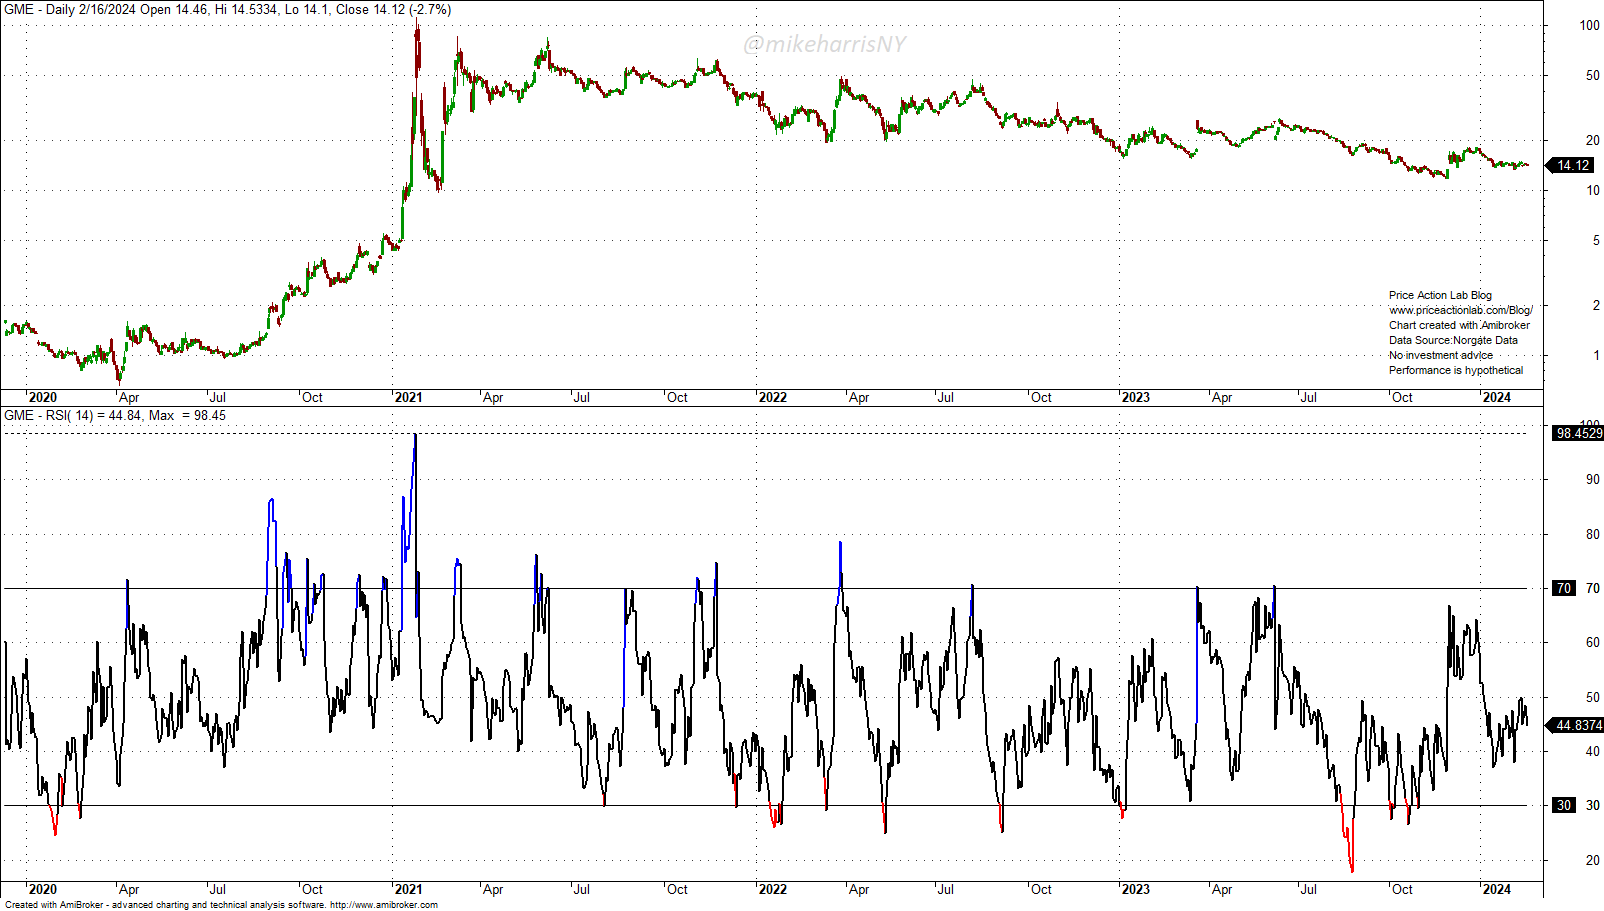
The 14-day RSI of GME reached 98.45 on January 27, 2021, and the following day the stock price cratered 44.3%.
However, this is not the only time in the past that the 14-day RSI of a stock has risen near 97. The claim that this occurred in GME is correct, but this has not been the only stock. The claim suffers from two biases:
- Recency
- Survivorship
In order to eliminate recency bias, we have to look at the history of currently listed stocks and determine whether the 14-day RSI has been as high as 97 in the past.
We also need to remove survivorship bias due to index rebalancing. For this purpose, we have to use historical series with delistings. This is what Norgate Data offers for several major US stock indices. We have to remove both biases. Otherwise, any analysis of highly overbought stocks will be biased towards survivors.
With Norgate data, it is easy to scan the history of index constituents to identify highly overbought stocks in the past. I use Amibroker, and I run an exploration after selecting the watchlist of the index of interest that includes current and past constituents.
For example, in the case of the Dow Jones Industrial Average with current & past, 14-day RSI greater than 96.5, starting in January 1990, we found no highly overbought stocks, current or past.
When we used the S&P 1500 composite with current & past, the exploration found many stocks, including SMCI and GME mentioned above. After doing some extra work to remove highly overbought conditions due to gaps or noise, we are left with some names. An example is Avista Corp. (AVA), which is a current index constituent.
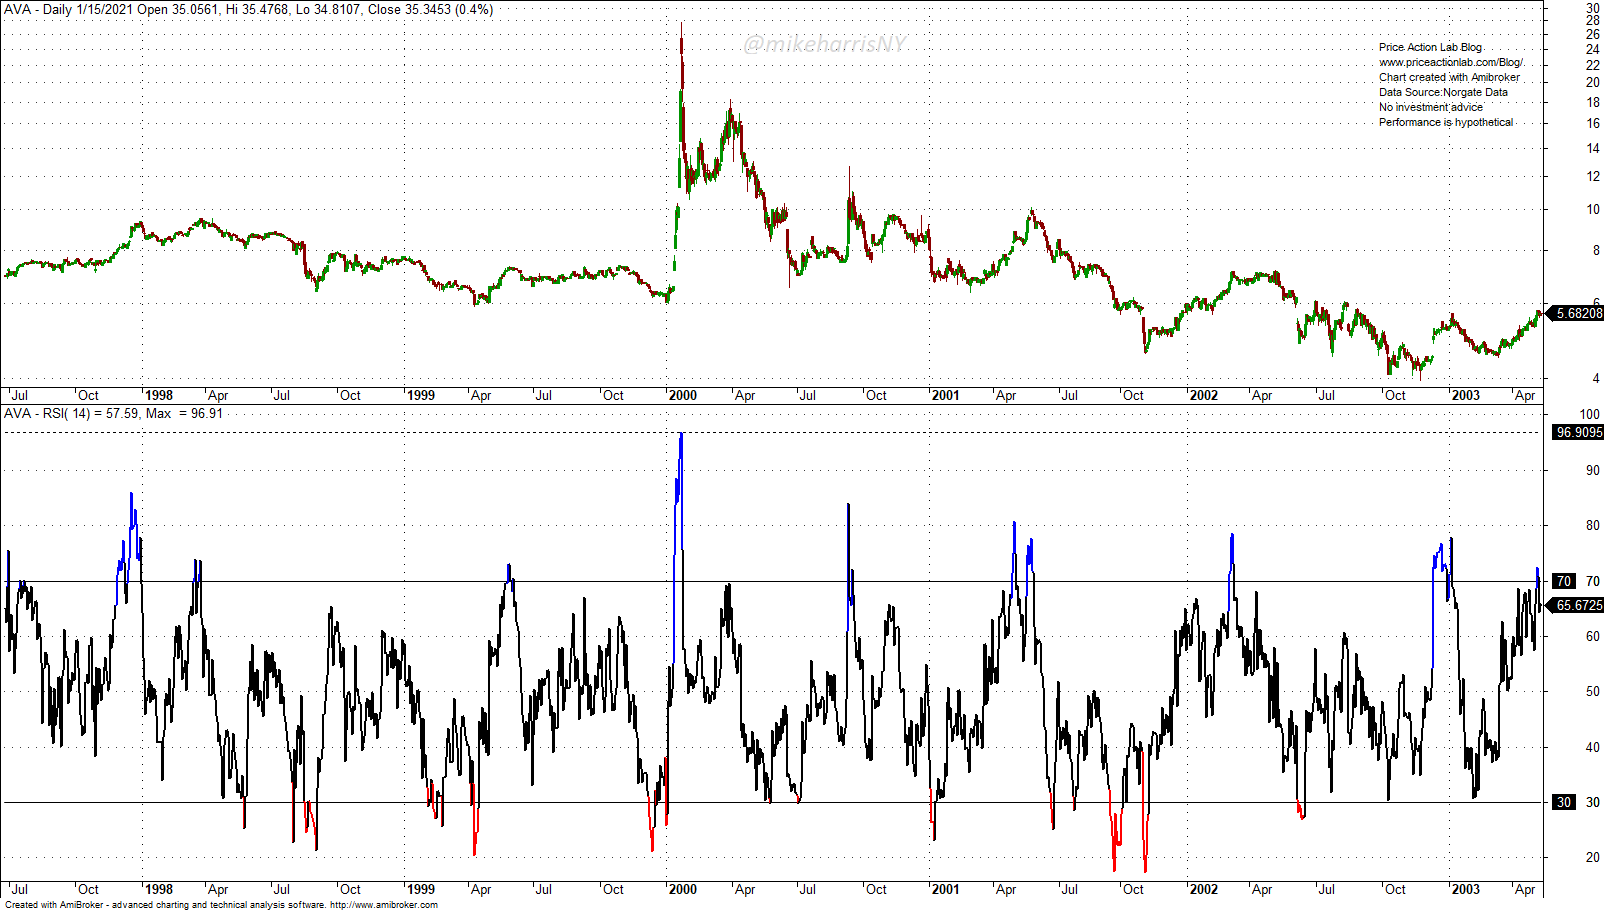
The AVA stock fell 17.5% after the 14-day RSI reached as high as 96.91
Next is an example of a delisted stock, Books-A-Million Inc. (BAMM).
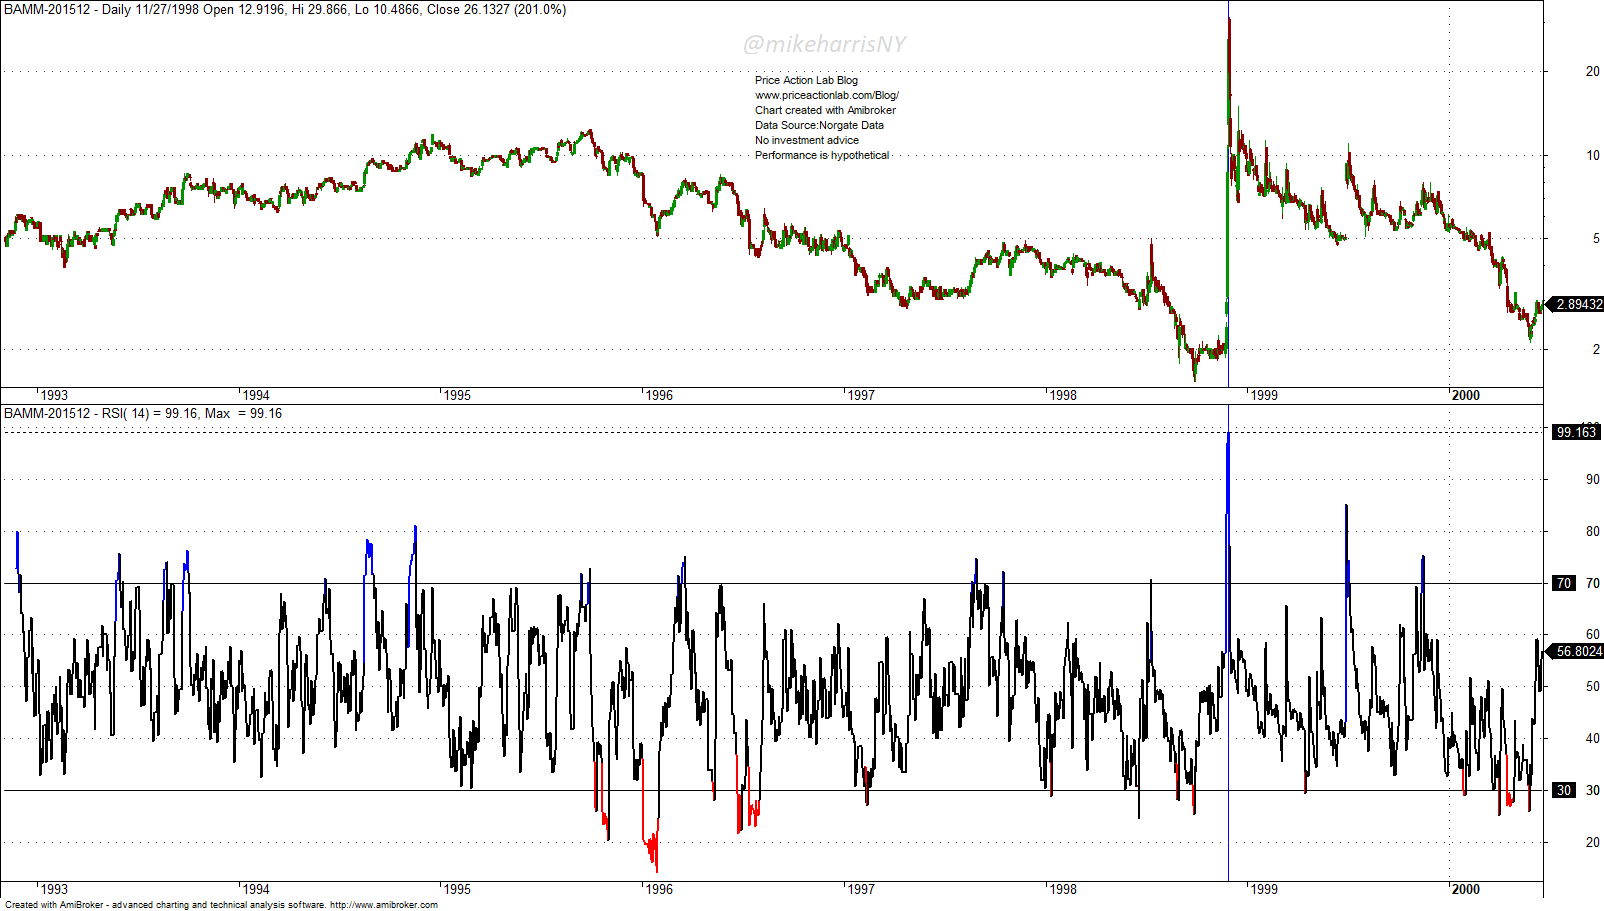
The stock price cratered nearly 75% after a high 14-day RSI value of 99.16.
Note that identifying the stocks with a high 14-day RSI value using Norgate Data is only the first step after removing noise. Since overbought stocks can get more overbought, developing a strategy to take advantage of these conditions is not easy. For example, in the case of BAMM above, a 14-day RSI of 96.93 was reached after a gain of 195.7%, but the following day, the stock gained an additional 201% for a 14-day RSI of 99.16. We have to differentiate between descriptive and predictive analysis; the latter is much harder, although without removing the biases, the former is impossible to do correctly.
There have been many other stocks that have reached extreme overbought levels in the past. The main purpose of this analysis was to bring attention to the following:
- Most financial social media claims about the markets are probably wrong.
- Proper analysis of equity markets requires removing biases and noise from the data.
- The transition from descriptive to predictive analysis is far from trivial.
Premium Content
Market analysis based on 30 years of skin-in-the-game
By subscribing, you have immediate access to hundreds of articles. Premium Articles subscribers have immediate access to more than two hundred articles, and All in One subscribers have access to all premium articles, books, premium insights, and market signal content.
Specific disclaimer: This report includes charts that may reference price levels determined by technical and/or quantitative analysis. No charts will be updated if market conditions change the price levels or any analysis based on them. All charts in this report are for informational purposes only. See the disclaimer for more information.
Disclaimer: No part of the analysis in this blog constitutes a trade recommendation. The past performance of any trading system or methodology is not necessarily indicative of future results. Read the full disclaimer here.
Charting and backtesting program: Amibroker. Data provider: Norgate Data
If you found this article interesting, you may follow this blog via RSS, Email, or Twitter.


