


An unexpected rise in inflation caused a left-tail drop in 2-Year Note futures on Tuesday, February 13, 2024.
According to the U.S. Bureau of Labor Statistics:
The index for all items less food and energy rose 3.9 percent over the past 12 months. The shelter index increased 6.0 percent over the last year, accounting for over two thirds of the total 12-month increase in the all items less food and energy index. Other indexes with notable increases over the last year include motor vehicle insurance (+20.6 percent), recreation (+2.8 percent), personal care (+5.3 percent), and medical care (+1.1 percent).
As a result of higher-than-expected inflation for January 2024, 2-Year Note futures fell -0.37, or 0.36%. This was a minus three standard deviations move based on the first differences (daily price changes) since June 25, 1990, as shown in the continuous back-adjusted chart below.
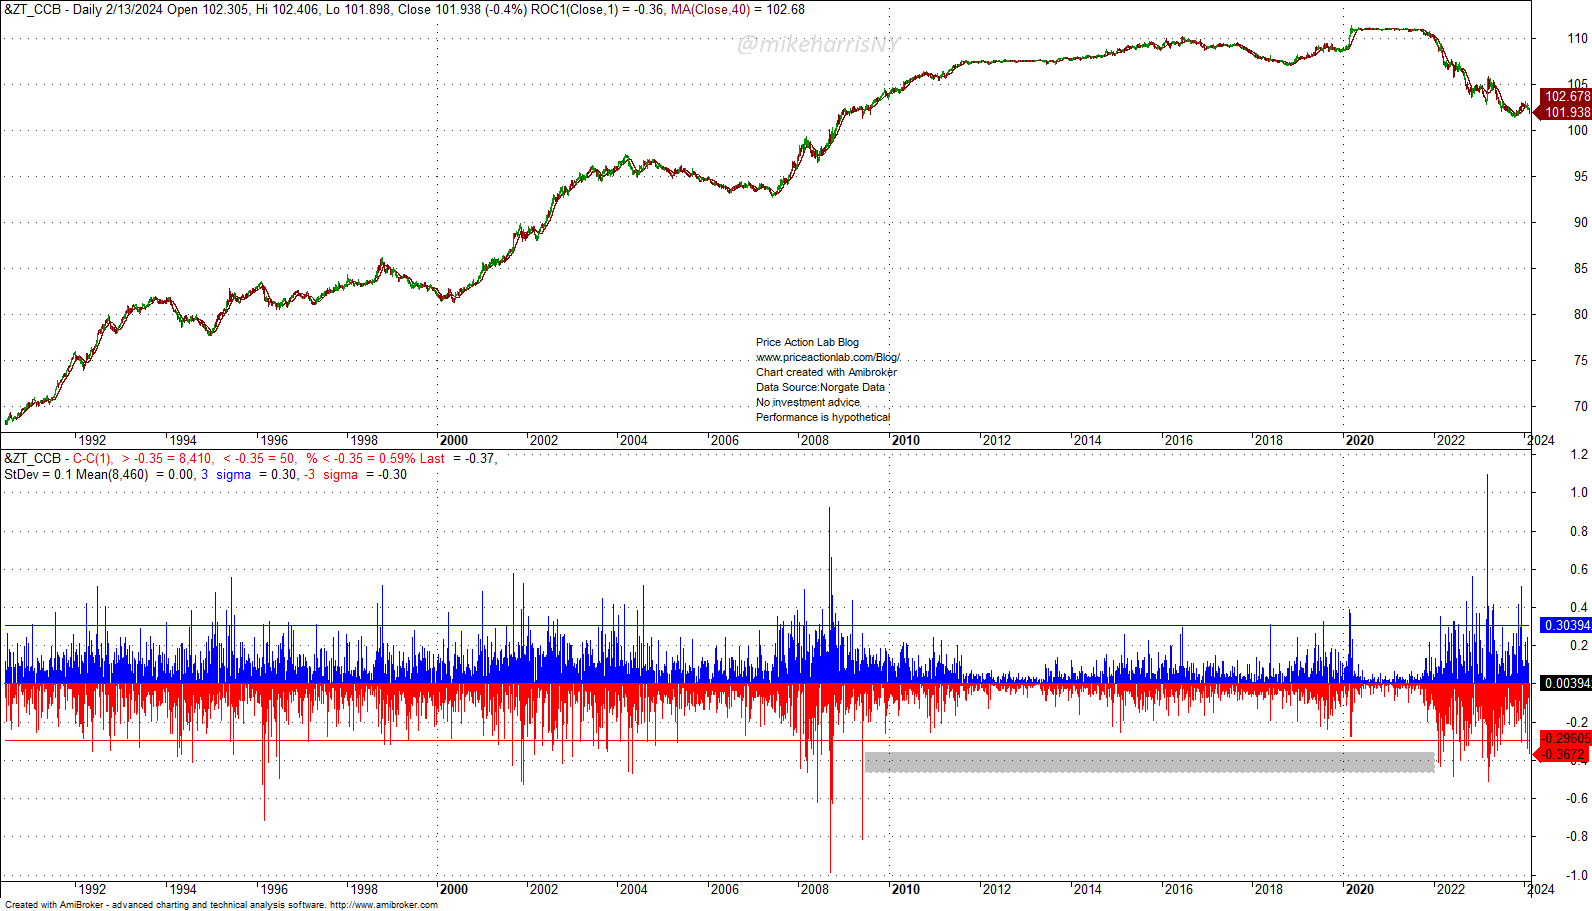
A few statistics: Based on 8,460 first differences, a drop of 0.35 or more has occurred only 50 times, or 0.59% of the time. Therefore, the daily change was a rare event. As marked on the chart, there was a long period of more than 12 years with no extreme events due to low rates and quantitative easing. This changed after 2022 and the rise in the fed funds rate due to rising inflation. Below is the histogram for the first differences.
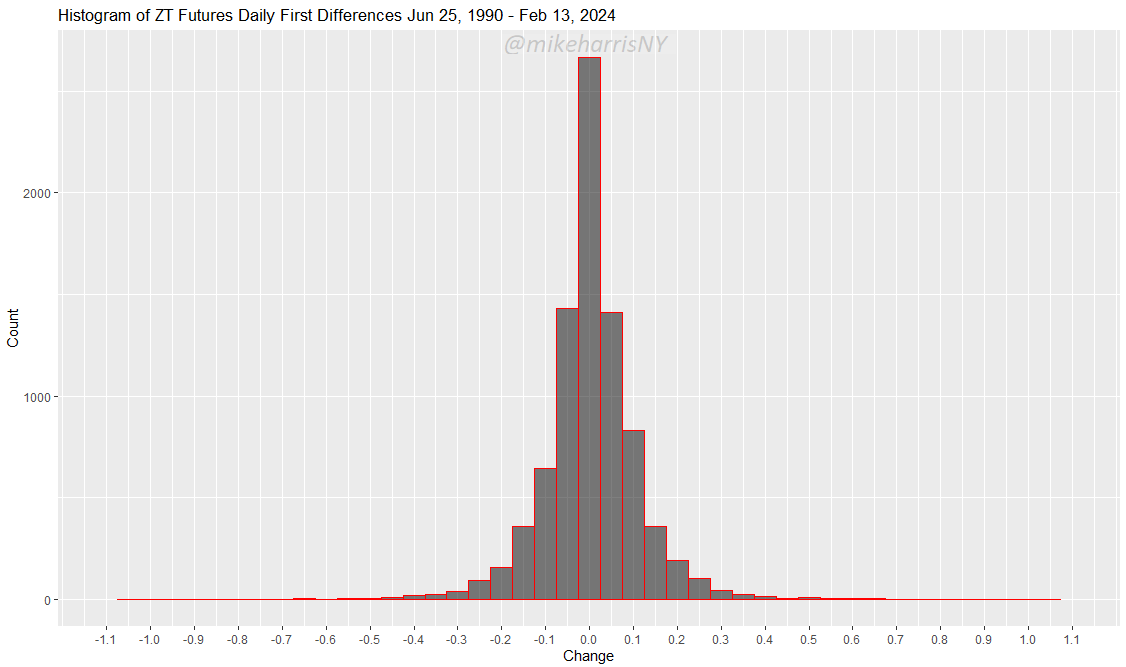
A change of -0.37 is on the left tail of this leptokurtic distribution, which has a kurtosis of 9.85.
Also note that in March 2023, there were three extreme right-tail events due to the regional banking crisis. The left-tail events are problematic because they denote increasing uncertainty and higher risks, even in the shorter duration part of the yield curve.
Incidentally, the move in the 10-year Note futures was not as extreme due to the nature of the distribution. During the period of quantitative easing, there were several extreme down moves in the 10-Year Note futures.
Premium Content
Market analysis based on 30 years of skin-in-the-game
By subscribing, you have immediate access to hundreds of articles. Premium Articles subscribers have immediate access to more than two hundred articles, and All in One subscribers have access to all premium articles, books, premium insights, and market signal content.
Specific disclaimer: This report includes charts that may reference price levels determined by technical and/or quantitative analysis. No charts will be updated if market conditions change the price levels or any analysis based on them. All charts in this report are for informational purposes only. See the disclaimer for more information.
Disclaimer: No part of the analysis in this blog constitutes a trade recommendation. The past performance of any trading system or methodology is not necessarily indicative of future results. Read the full disclaimer here.
Charting and backtesting program: Amibroker. Data provider: Norgate Data
If you found this article interesting, you may follow this blog via RSS, Email, or Twitter.


