


It is hard to define market bubbles. All attempts to identify bubbles are highly subjective.
What is a market bubble? The common definition is that a bubble is a rapid rise in asset prices. But that is part of the story. There must be a crash after the quick rise. We can only identify a bubble after it bursts. Ex-ante identifications are only speculations.
One way to try to identify a bubble is by looking at the price rate of change. If the rate of change is an outlier based on a suitable lookback period, then we can speculate that a bubble is forming. We run into a problem here: what is a suitable lookback period?
For example, the Mag 7 stocks are up 160.5% since January 3, 2023 (to March 4, 2024). This smells, to some people, like a bubble. But since January 3, 2022, those stocks (equally weighted) have been up 30.9%. Is this a bubble? The performance depends on the lookback period. How can we select a suitable lookback period that will offer some unbiased estimate of whether we are dealing with a bubble? Is that even possible?
It may not be possible to have an unbiased ex-ante identification of a bubble. However, in this particular case, we can try the following: We know the NASDAQ-100, which is driving the market higher, bottomed around January 5, 2023. If we set our lookback period to 291 trading days from that bottom to March 4, 2024, and we calculate the rolling rate of change, we get the following chart:
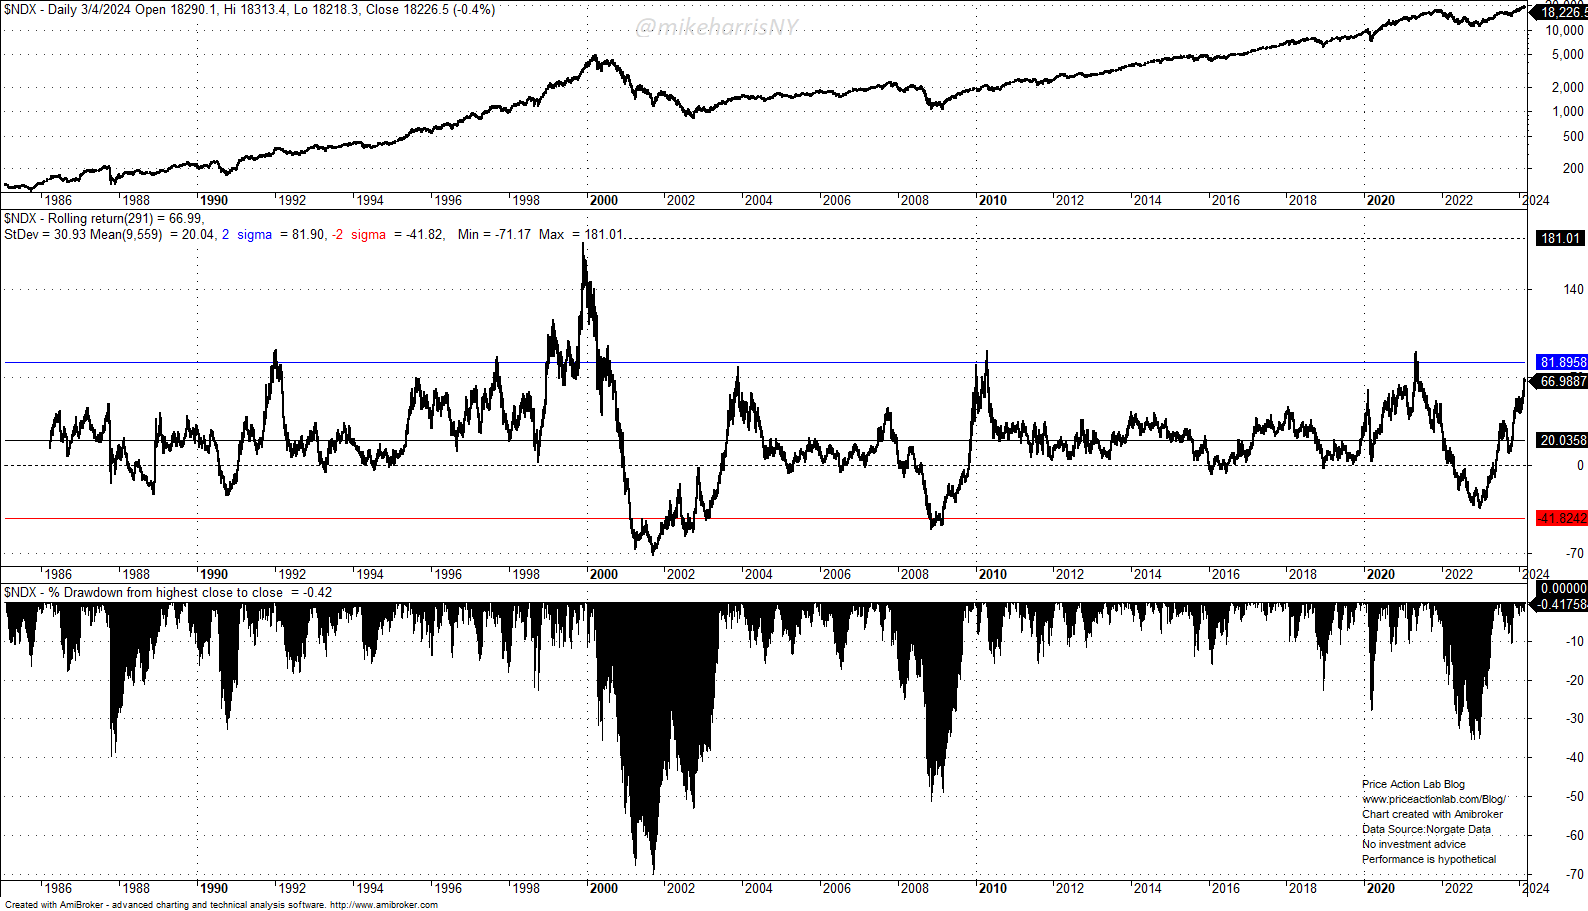
The index has gained 67% in the 191-day lookback period. Based on the available sample, the mean is 20%, and the standard deviation is 30.9%. The two-sigma level is at 81.9%. We observe that each time the 191-day return was two standard deviations above the mean, there was a correction of more than 10%, or a bear market. The outlier is the dot-com rally with a five-sigma move!
A bubble can inflate more, as in the 1990s. A small bubble can turn into a large bubble. Traders and investors can scream at the bubble while it inflates more. Although in most cases, a two-sigma move for the 191-day return ended with a large correction or bear market, there is that one outlier that tells us the distribution is fat-tailed. It can happen again.
There were seven 10% corrections from 1999 to 2000. There were about a dozen 10% or more corrections from 1995 to 2000! The bubble continued to inflate each time until it could not last any longer.
Where are we now? No one knows. A bubble is forming, but the process can go on for several years with many interim corrections, as in the 1990s, or a bear market can start. Calling a market a bubble is not enough; the identification of the end of the inflation process is more important, and this is probably the hardest thing about the markets. Being bullish is easy. Historically, the markets have reached new all-time highs. Bullish forecasts are technically called “naïve.” On the other hand, a forecast of a bubble about to burst can be foolish.
Premium Content
Market analysis based on 30 years of skin-in-the-game
By subscribing, you have immediate access to hundreds of articles. Premium Articles subscribers have immediate access to more than two hundred articles, and All in One subscribers have access to all premium articles, books, premium insights, and market signal content.
Specific disclaimer: This report includes charts that may reference price levels determined by technical and/or quantitative analysis. No charts will be updated if market conditions change the price levels or any analysis based on them. All charts in this report are for informational purposes only. See the disclaimer for more information.
Disclaimer: No part of the analysis in this blog constitutes a trade recommendation. The past performance of any trading system or methodology is not necessarily indicative of future results. Read the full disclaimer here.
Charting and backtesting program: Amibroker. Data provider: Norgate Data
If you found this article interesting, you may follow this blog via RSS, Email, or Twitter.


