


Cocoa surged 25.4% this week, and it is up 106% year-to-date. Since 2023, cocoa is up 261%. Price action in cocoa has been in the tails of distribution for the better part of this year due to harvest problems and supply shortages.
This week (March 11–March 15, 2024), cocoa prices surged 25.4%. Based on back-adjusted futures contracts since 1980, the weekly change was 1,622 points and that represents an 18-sigma event based on the available sample of 2,308 weekly changes.
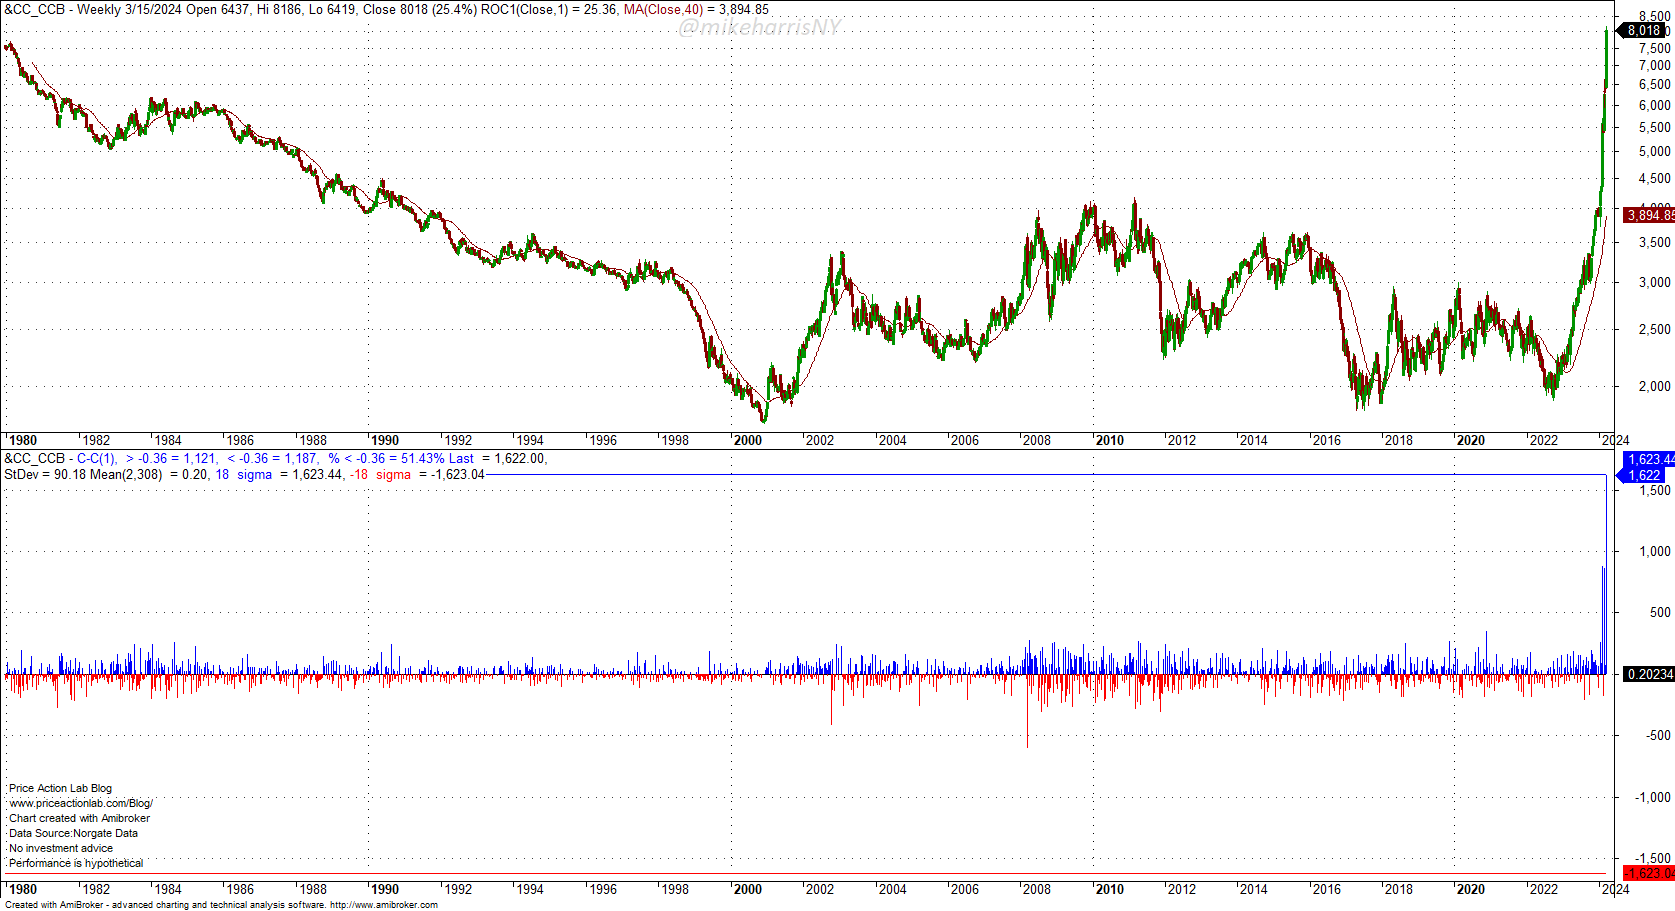
In terms of percentage changes, this week’s 25.4% move was a 6-sigma event based on the same sample and continuous contracts.
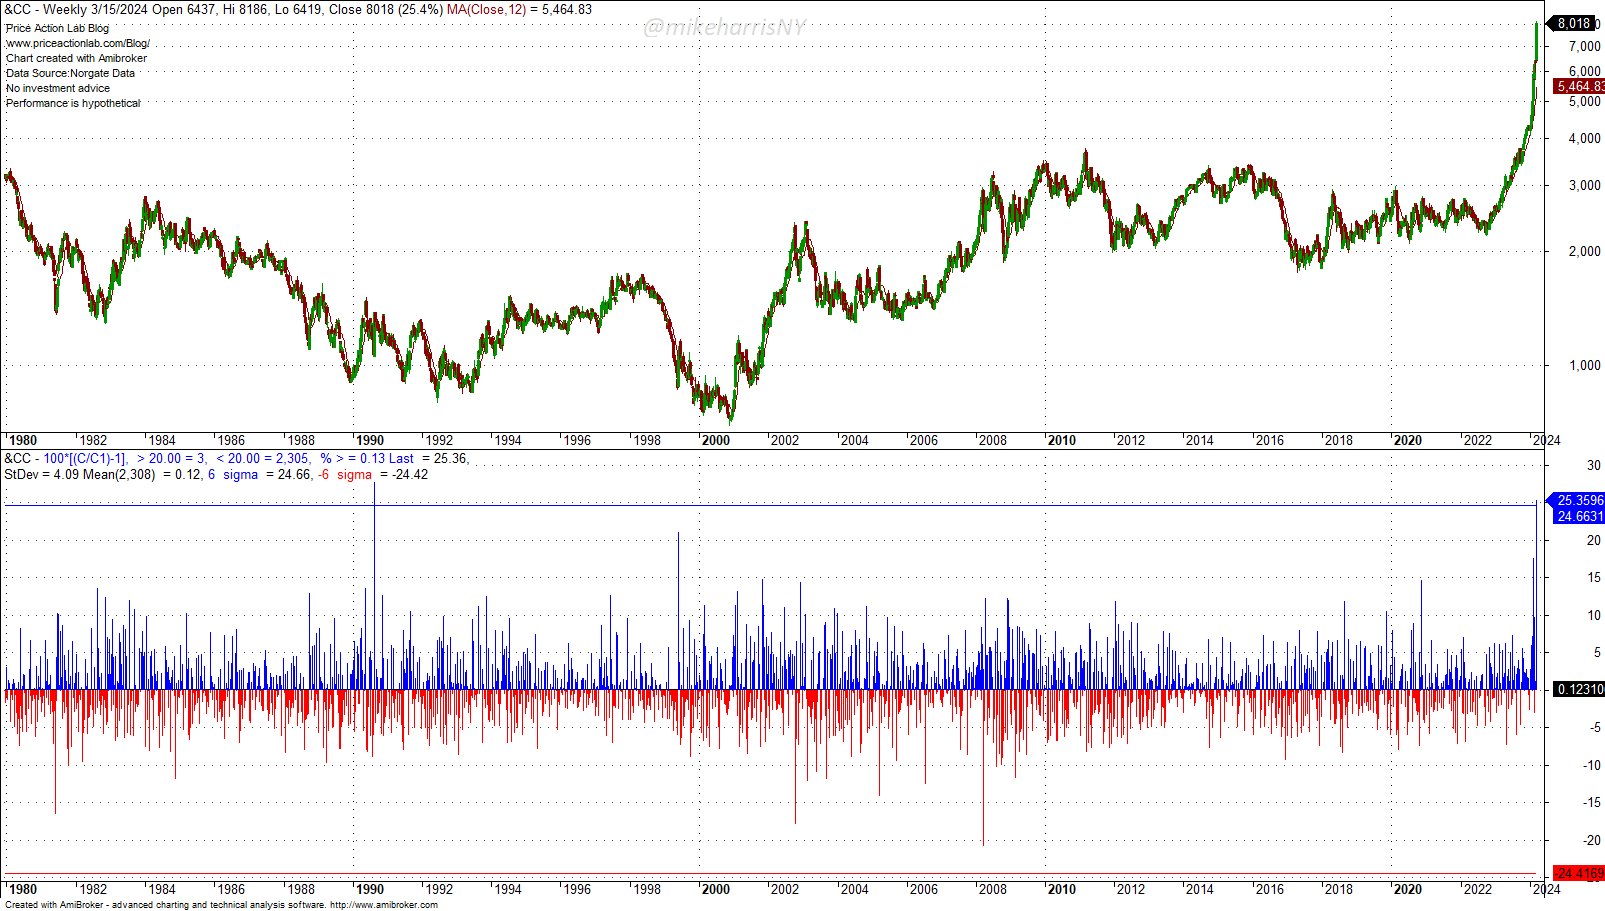
Similar tail events have occurred in commodities in the past but have been rare. A recent tail event was an 11-sigma move in percentage terms and a 17-sigma move in weekly changes in wheat for the week ending March 4, 2022.
Back to cocoa, it is unclear when the market will return to normal conditions, and it is also hard to forecast a price equilibrium level. The only certainty is that much higher prices are in store for chocolate products.
Premium Content
Market analysis based on 30 years of skin-in-the-game
By subscribing, you have immediate access to hundreds of articles. Premium Articles subscribers have immediate access to more than two hundred articles, and All in One subscribers have access to all premium articles, books, premium insights, and market signal content.
Specific disclaimer: This report includes charts that may reference price levels determined by technical and/or quantitative analysis. No charts will be updated if market conditions change the price levels or any analysis based on them. All charts in this report are for informational purposes only. See the disclaimer for more information.
Disclaimer: No part of the analysis in this blog constitutes a trade recommendation. The past performance of any trading system or methodology is not necessarily indicative of future results. Read the full disclaimer here.
Charting and backtesting program: Amibroker. Data provider: Norgate Data
If you found this article interesting, you may follow this blog via RSS, Email, or Twitter.


