


The “turnaround Tuesday” anomaly disappears if we take into account the overnight effect and random short squeezes in bear markets.
The “turnaround Tuesday” (TAT) anomaly refers to stocks bouncing back on Tuesday after a down Monday. This effect appears to be a random combination of the overnight anomaly and random short squeezes during bear markets. If we control for these two confounders, there is no anomaly.
All backtests below are from the inception of ETFs to March 25, 2024, and include a small commission of $0.01 per share based on fully invested equity.
First, this is a backtest of the TAT anomaly for SPY ETF.
TAT anomaly: Buy at the close of a down Monday and sell at the close of Tuesday
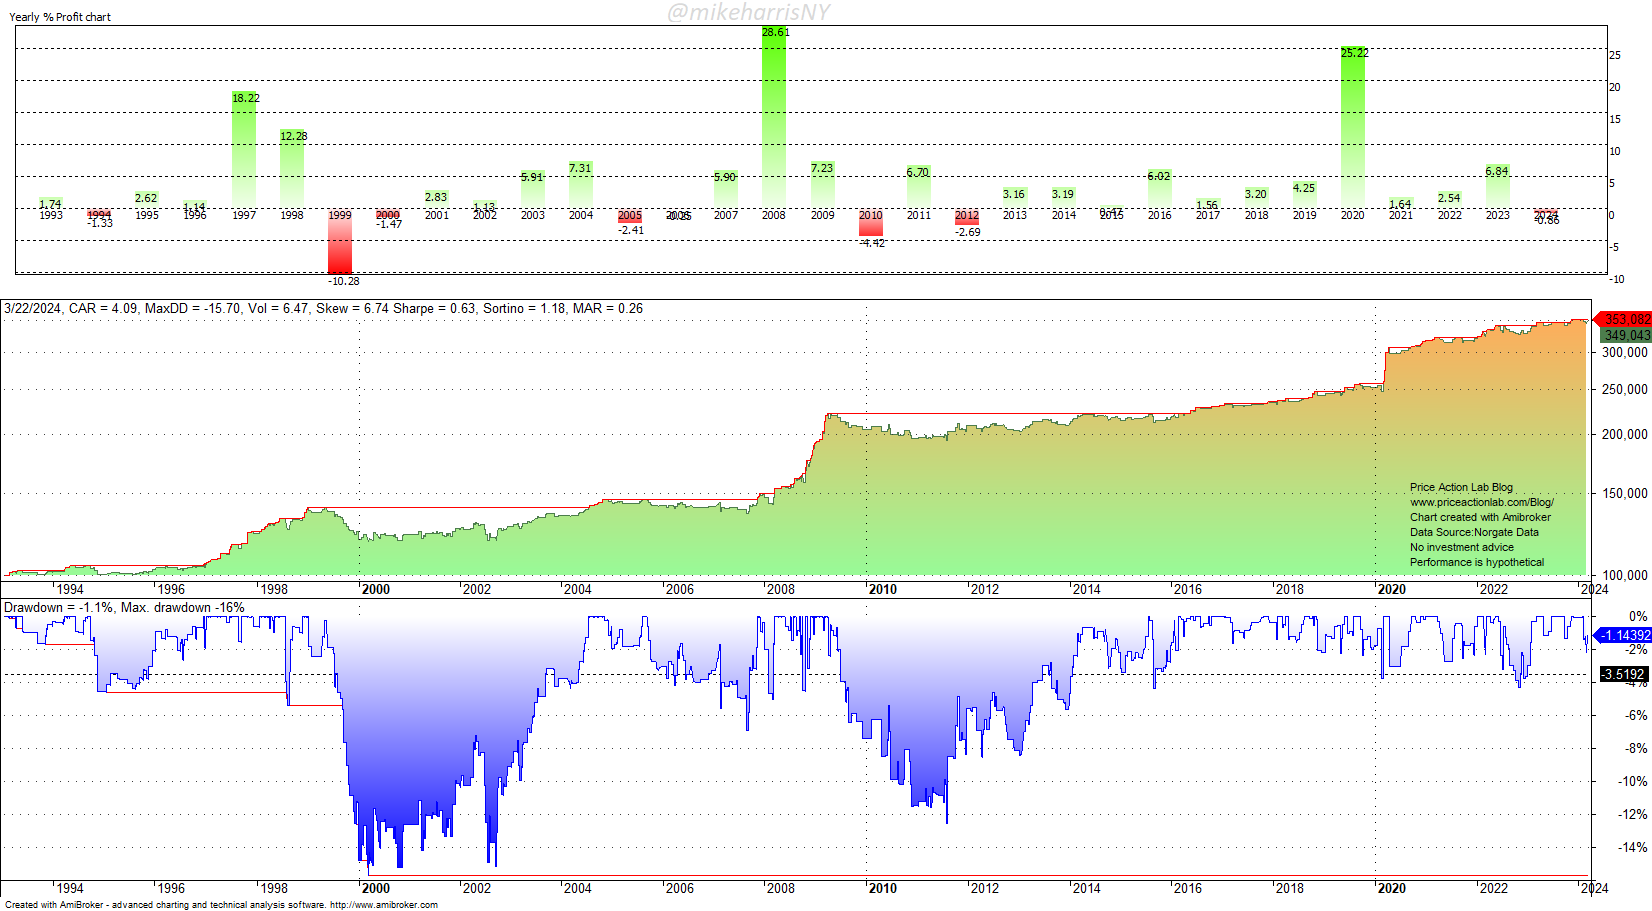
The annualized return is 4.09% and Sharpe is 0.63. In the case of buy and hold, the annualized return is 10.3% and Sharpe is 0.55. Therefore, the TAT anomaly has generated about 40% of the annualized return, and the higher Sharpe indicates it is rather robust. But these are the first reactions you find in popular articles.
What are the flaws here, or possible confounders that offer an impression of robustness for this anomaly? First, we notice outlier gains in 2008 and2020, and also a small gain in 2022, all bear markets. During bear markets, there are random short squeezes and naturally, some will fall on Tuesdays. Then there is the notorious “overnight effect.” We need to control for all of these effects to determine whether TAT is a true anomaly.
Below is the backtest that excludes 2008, 2020, and 2022 results, with buying at the open of Tuesday rather than at the close of Monday.
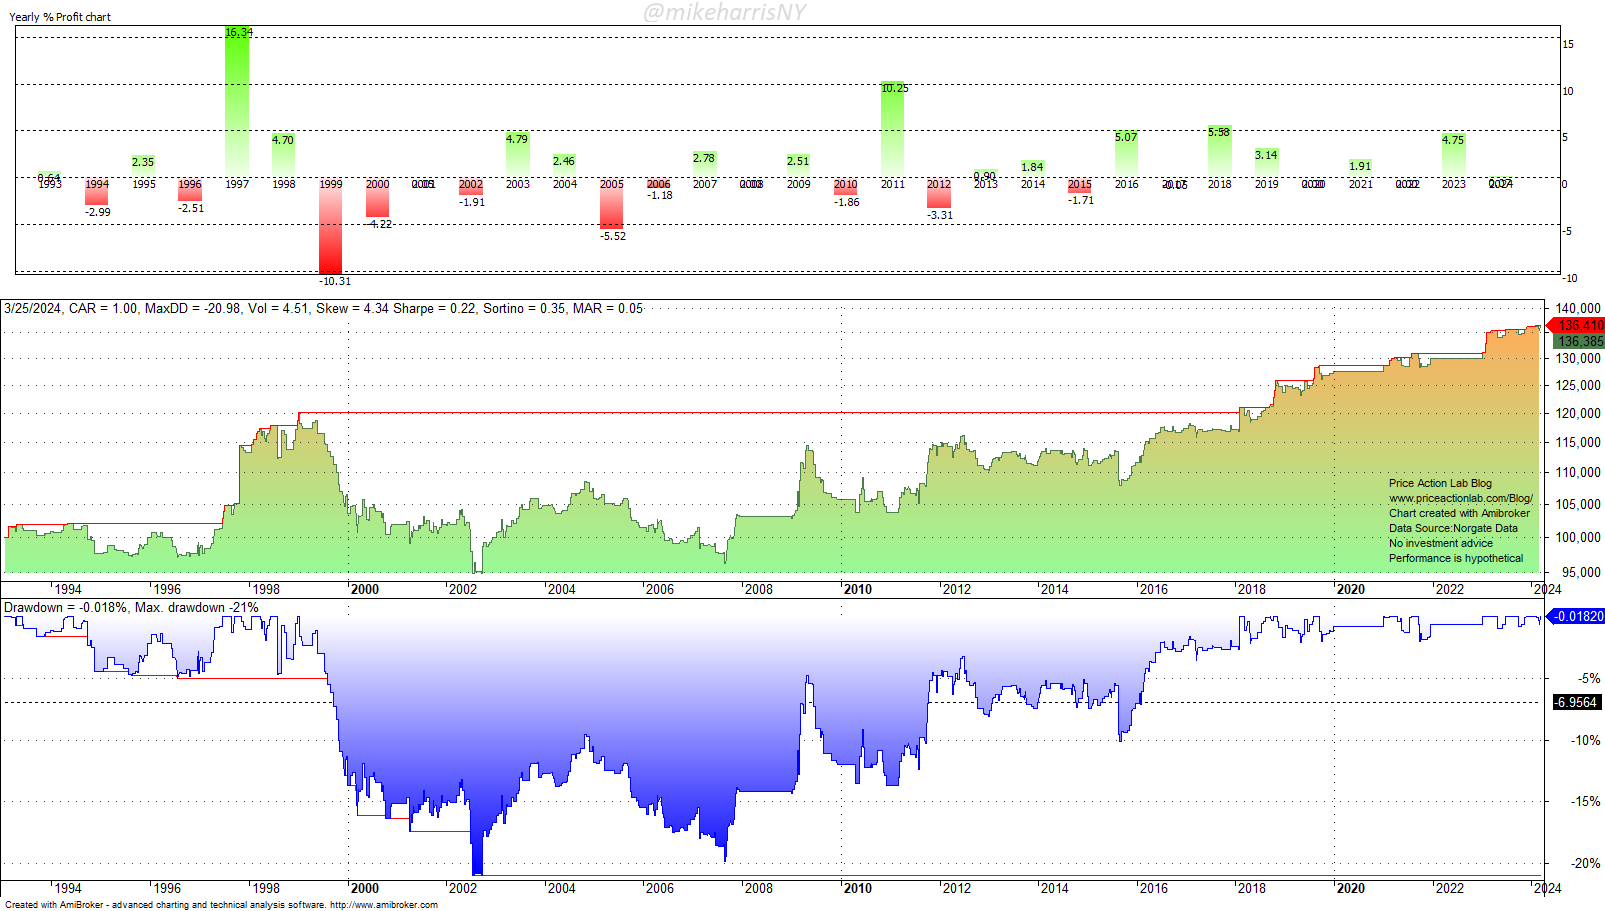
Voila! After controlling for the overnight effect and short squeezes, the effect disappears with the annualized return and Sharpe dropping to 1% and 0.22, respectively.
If we take a closer look at bear market rallies, we will notice that, as expected, a good fraction of those have occurred on Tuesdays.
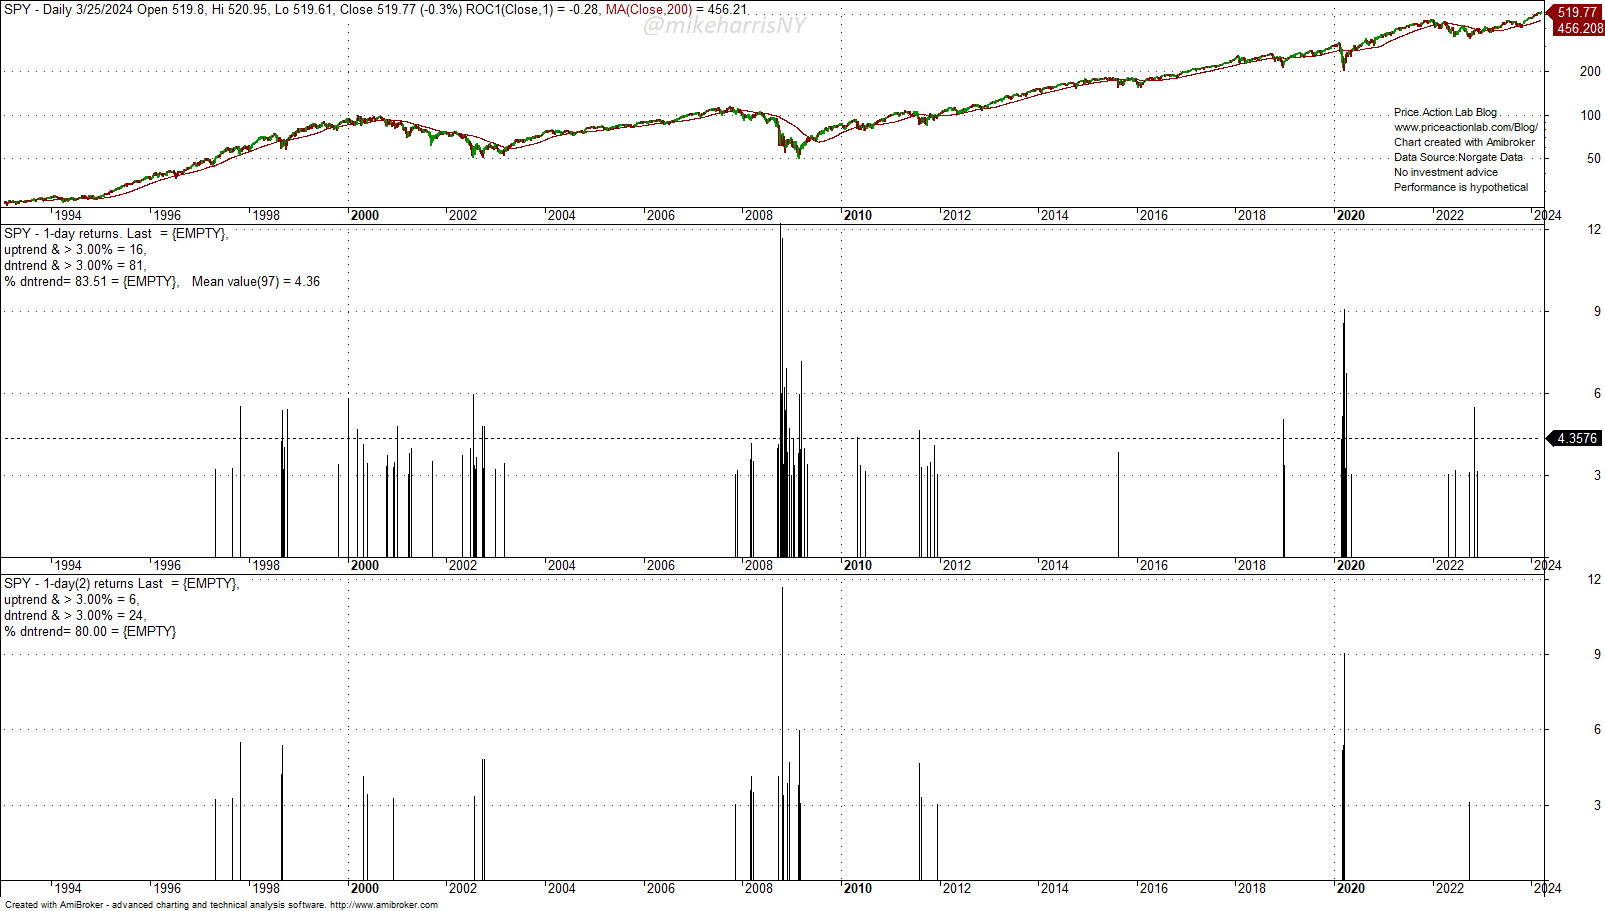
Here, we define an uptrend for the purposes of this analysis as the condition when price is below the 200-day moving average. The top chart shows all daily returns greater than 3% in uptrends and downtrends. Specifically, in downtrends, there have been a total of 81 daily returns greater than 3%. The bottom chart shows only those returns greater than 3% that have occurred on Tuesdays. In the case of downtrends, the number fell to 24 from 81 but that is what we expected. With a uniform distribution, we would expect to see 16 of those +3% returns in downtrends but instead there are 24. Those are enough, in combination with the overnight effect, to offer the perception of a robust anomaly. There is no reason to believe that Tuesday is a special day that deserves more rebound rallies; a proportion of 26% versus a uniform 16% is a random effect that will vanish in the limit of large samples and as a result, the anomaly will also vanish.
The counterargument, of course, could be that Tuesday is a special day due to investor behavioral effects. The term “behavioral” has been abused much in market literature in an effort to explain effects that are due to limited samples. When we start mixing psychology with quantitative analysis, anything is possible, even unicorns. The conclusion is that the TAT anomaly is a myth.
Premium Content
Market analysis based on 30 years of skin-in-the-game
By subscribing, you have immediate access to hundreds of articles. Premium Articles subscribers have immediate access to more than two hundred articles, and All in One subscribers have access to all premium articles, books, premium insights, and market signal content.
Specific disclaimer: This report includes charts that may reference price levels determined by technical and/or quantitative analysis. No charts will be updated if market conditions change the price levels or any analysis based on them. All charts in this report are for informational purposes only. See the disclaimer for more information.
Disclaimer: No part of the analysis in this blog constitutes a trade recommendation. The past performance of any trading system or methodology is not necessarily indicative of future results. Read the full disclaimer here.
Charting and backtesting program: Amibroker. Data provider: Norgate Data
If you found this article interesting, you may follow this blog via RSS, Email, or Twitter.


