


The weekly market reports include a stock market forecast and an analysis of capital markets. Access to the full report requires a Premium Articles, Weekly Premium Articles, or All-in-One subscription.
Included in this weekly market report:
- The well-traveled road effect.
- Back in business.
- The Fed has already cut.
Weekly Summary (March 18–March 22, 2024)
- Large-cap stocks rose after a dovish FOMC meeting.
- Bond prices found support from Fed comments.
- Commodities were mixed during the week.
- The US dollar gained due to rising geopolitical tensions.
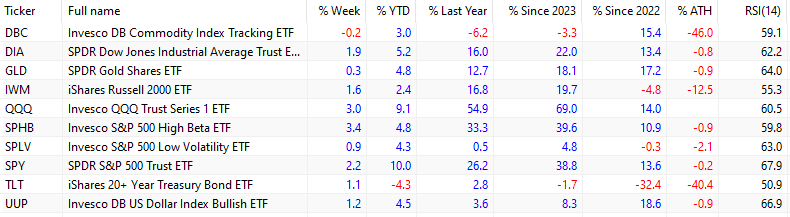
The spot price of crude oil fell 1% this week to $81.10 per barrel. Year-to-date, spot crude oil is up 12.8%. The DBC ETF fell 0.2% due to the mixed performance of grains and precious metals. Gold (GLD) was up 0.3% despite a stronger U.S. dollar index (UUP), which gained 1.2% for the week. Gold (GLD) has outperformed the SPY ETF by a wide margin since 2022, 17.2% versus 13.6%, respectively.
Large-cap stocks (SPY) rose 2.2% for the week after a dovish FOMC meeting. Tech stocks (QQQ) jumped 3% to new, all-time highs. Small caps (IWM) added 1.6% but are down 12.5% from their all-time highs.
High beta large caps (SPHB) surged 3.4% due to expectations of rate cuts this year, but low-volatility large caps (SPLV) gained only 0.9%. The Dow Jones Industrial Average (DIA) ended the week up 1.9%. The magnificent 7 equal-weight index rallied 4.2% for the week, with large gains and only AAPL down 0.2%. GOOGL gained 6.8%, coming in second after NVDA, which surged 7.2%.
The bond market found support after the FOMC meeting. The TLT ETF gained 1.1% for the week. Since January 3, 2022, the TLT ETF has been down 32.4%, while large-caps (SPY) have gained 13.6%.
The well-traveled road effect
The well-traveled road effect is a cognitive bias in which travelers will estimate the time taken to traverse routes differently depending on their familiarity with the route. Frequently travelled routes are assessed as taking a shorter time than unfamiliar routes. Source: Wikipedia
The well-traveled road effect is prevalent in both technical and fundamental analyses of markets. Various analysts rely on known methods rather than exploring new ones, which may be more applicable to the current market regime.
The well-traveled road cognitive bias may also cause an underestimation of the timing of the next large correction or bear market due to a reliance on past data. Specifically, statistical expectations are relevant in the ensemble domain but do not apply in the time domain due to non-stationarity.
The most important source of risk due to this cognitive bias is the underestimation of the impact of new technologies, for example, artificial intelligence. Familiarity with previous technologies may cause an underestimation of the time and impact of rapidly evolving technologies. The economic system may not be prepared for drastic changes and could face significant stress and even a risk of collapsing. It took five decades from the invention of the transistor to the development of fast GPUs for running large language models (LLMs). The next step towards artificial general intelligence (AGI) may take only a few years and this is a short time for preparing for the impact of this technology.
The risks of a Minsky moment and the end of capitalism have increased due to the accelerated application of technology with an unknown impact. Initially, the proponents of the technology argued that the acceleration would be toward higher efficiency but after being confronted with counterarguments, they are now arguing that there may be initial turmoil but afterward the system will reach a new and improved equilibrium. These views are based on wishful thinking and ignore the precautionary principle.
Stock Market Forecast
The forecasting model generates well-defined entry and exit signals for the SPY ETF. The model does not forecast exact tops and bottoms, but the objective is to minimize losses due to large corrections and maximize gains in uptrends. The accuracy has been close to 100% in the last 32 years. Below is the current signal, duration, and strength.
Access to the full report requires a Premium Articles, Weekly Premium Articles, or All-in-One subscription.
|
This post is for paid subscribers
Already a subscriber? Sign in |
Specific disclaimer: This report includes charts that may reference price levels. If market conditions change the price levels or any analysis based on them, we may not update the charts. All charts in this report are for informational purposes only. See the disclaimer for more information.
Disclaimer: No part of the analysis in this blog constitutes a trade recommendation. The past performance of any trading system or methodology is not necessarily indicative of future results. Read the full disclaimer here.
Charting and backtesting program: Amibroker. Data provider: Norgate Data
If you found this article interesting, you may follow this blog via RSS, email, or Twitter.


