


Since 2002, this ETF seasonality strategy has had no losing years in backtests. We also include backtests from 1990 that use the same underlying index that the ETF tracks.
The article was updated on April 23, 2024, with a long-short version of the strategy. Active Market Signals and All in One subscribers who have renewed at least once already, as well as new subscribers with a 6- or 12-month subscription, will have access to the strategy rules. We will terminate this offer on April 28, 2024.
Backtest Results
Market: Unleveraged ETF
Timeframe: Daily
Backtest period: 01/02/2002-03/28/2024
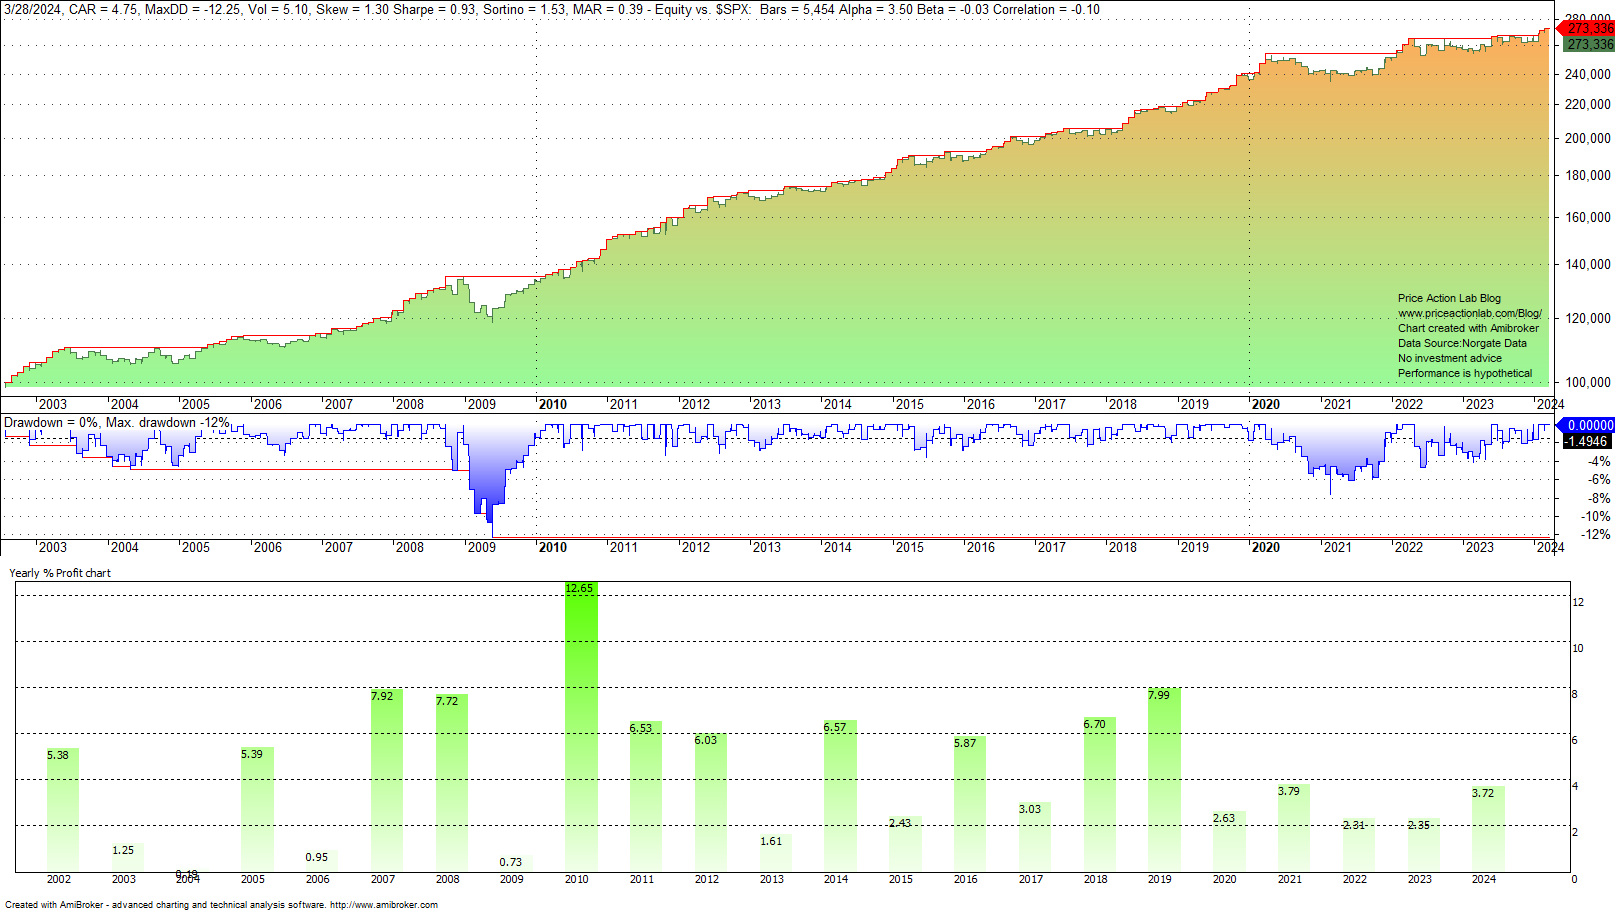
There are no losing years. The Sharpe ratio is 0.93 with a 12.3% maximum drawdown. These statistics allow the use of a leveraged ETF. Below is the backtest for the 3x leveraged ETF.
Backtest Results
Market: Leveraged ETF (3x)
Timeframe: Daily
Backtest period: 01/04/2010-03/28/2024
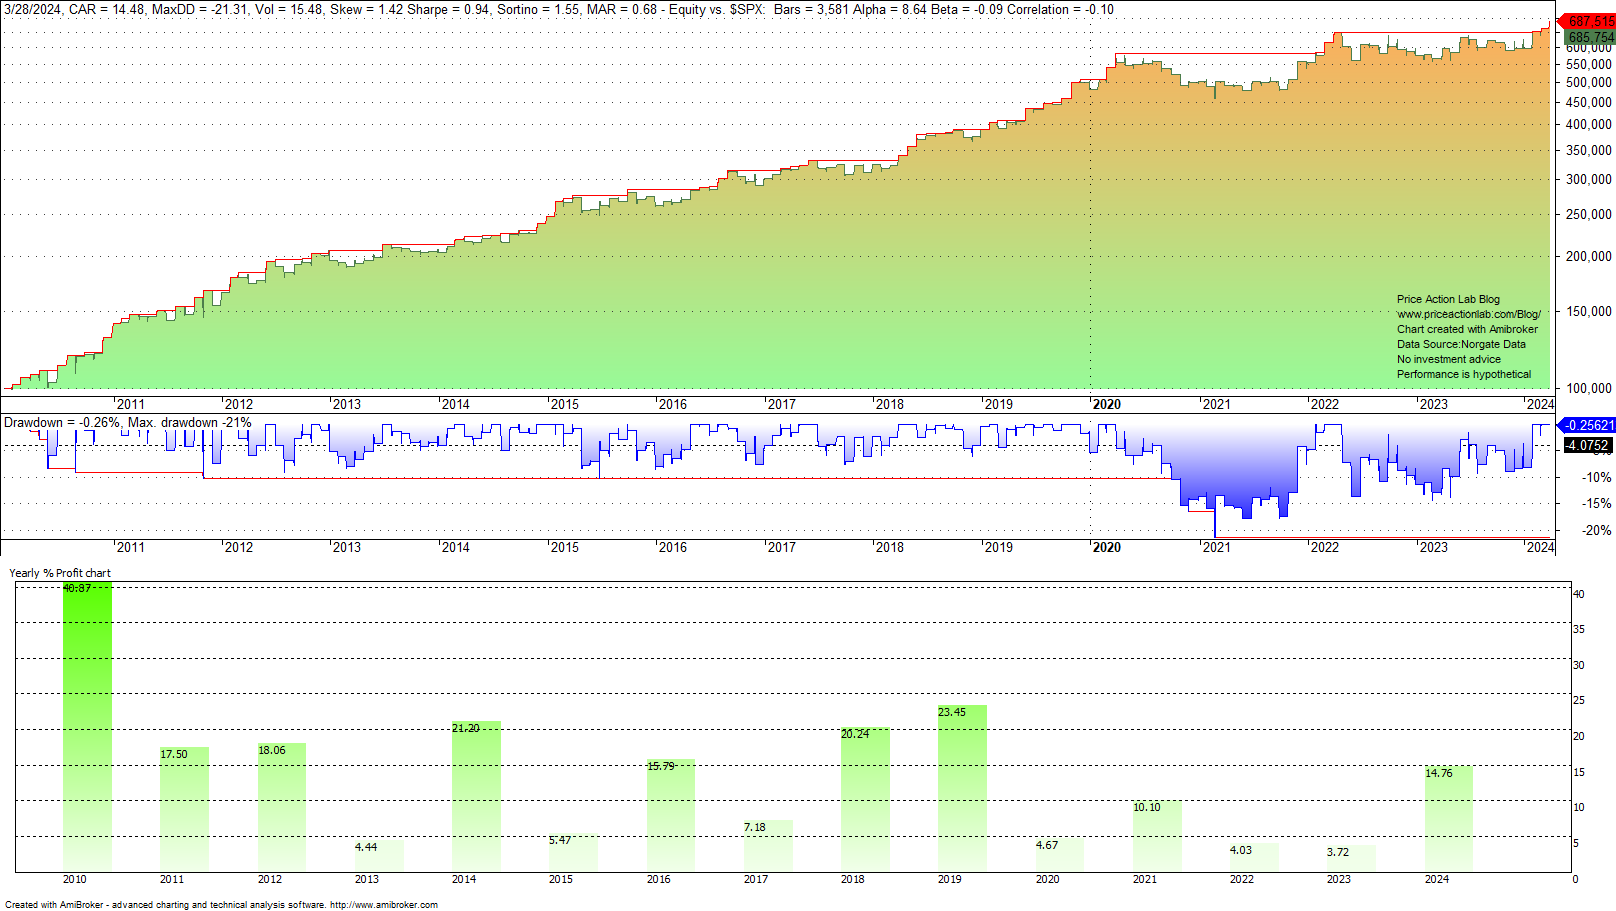
Backtest statistics
| Annualized return | 14.4% |
| Maximum drawdown | -21.3% |
| Volatility | 15.4% |
| Sharpe ratio | 0.93 |
| Beta | -0.1 |
| Skew of the equity curve | 1.42 |
| Win rate | 61.4% |
| Trades | 171 |
| Payoff ratio | 1.22 |
| Average holding period (days) | 4 |
| Exposure | 14.3% |
With an exposure of only 14.3% and a holding period of three days, this strategy has had an annualized return of 14.4% since 2010. The Sharpe ratio is 0.93. The skew of the equity curve is 1.42, and beta is close to zero. These statistics make this strategy a potential diversifier. See “caveat emptor” below.
Long-term backtest
We used the underlying index that the ETF has tracked closely since 1990.
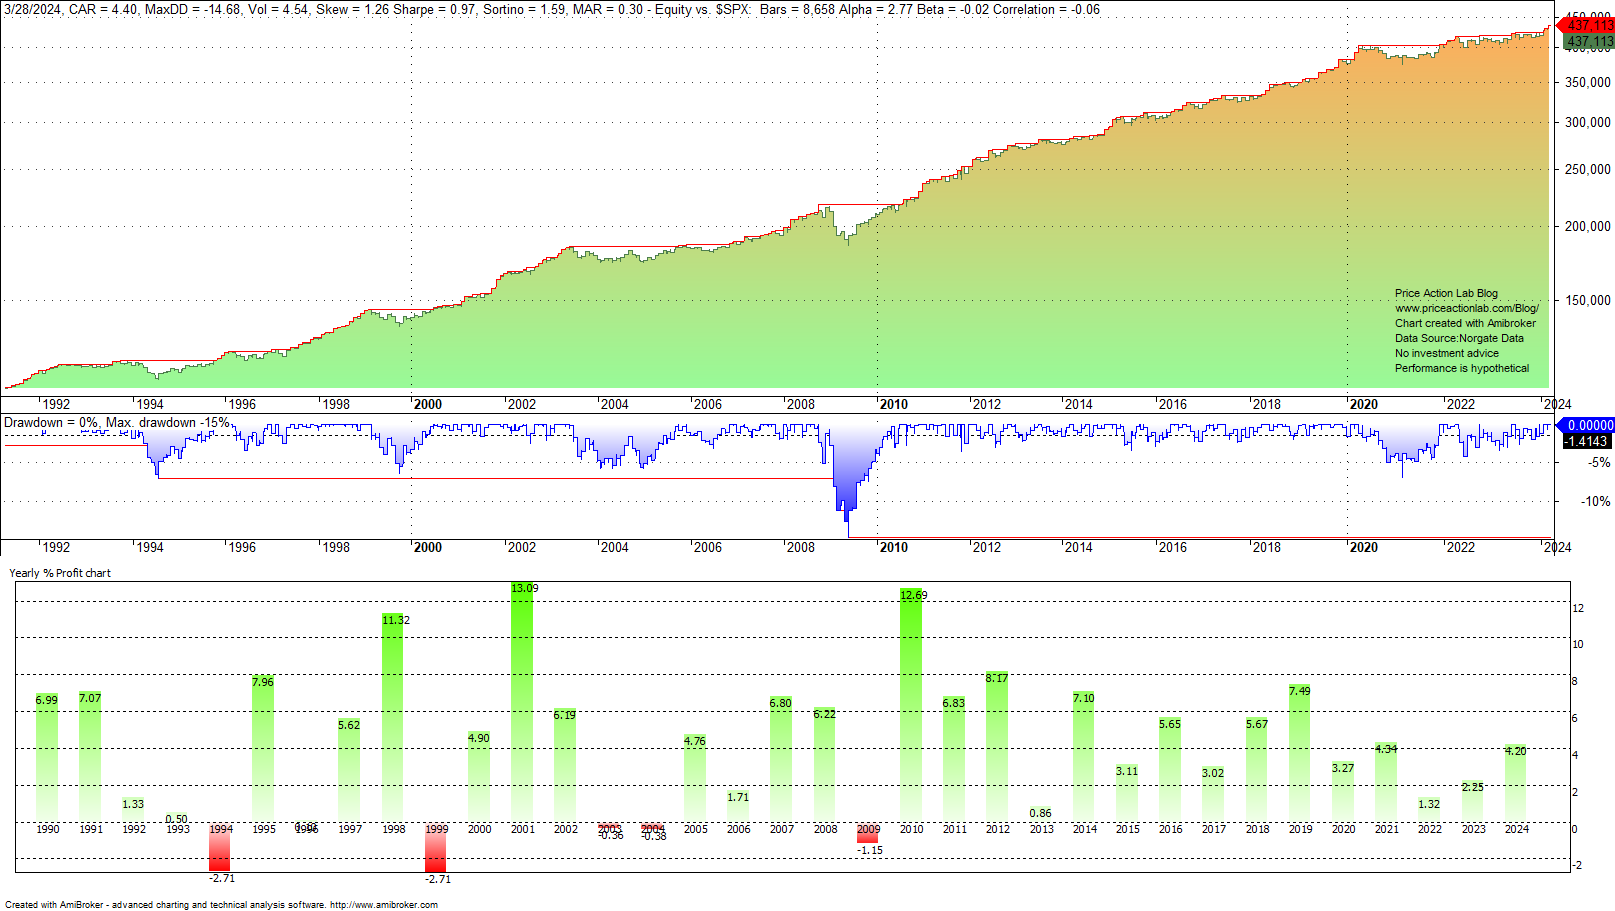
The long-term results have comparable statistics with those of the unleveraged ETF. The Sharpe ratio is a little higher at 0.97, and the maximum drawdown is 14.7%. Beta is close to zero, and skew is 1.26. These statistics make the use of this seasonality strategy as a diversifier look promising.
Update on April 23, 2024: Long-short version with leveraged ETFs. The strategy makes use of an inverse ETF for the short position, and there is no direct shorting.
Backtest Results
Market: Leveraged ETFs (3x) long-short
Timeframe: Daily
Backtest period: 01/04/2010-04/22/2024
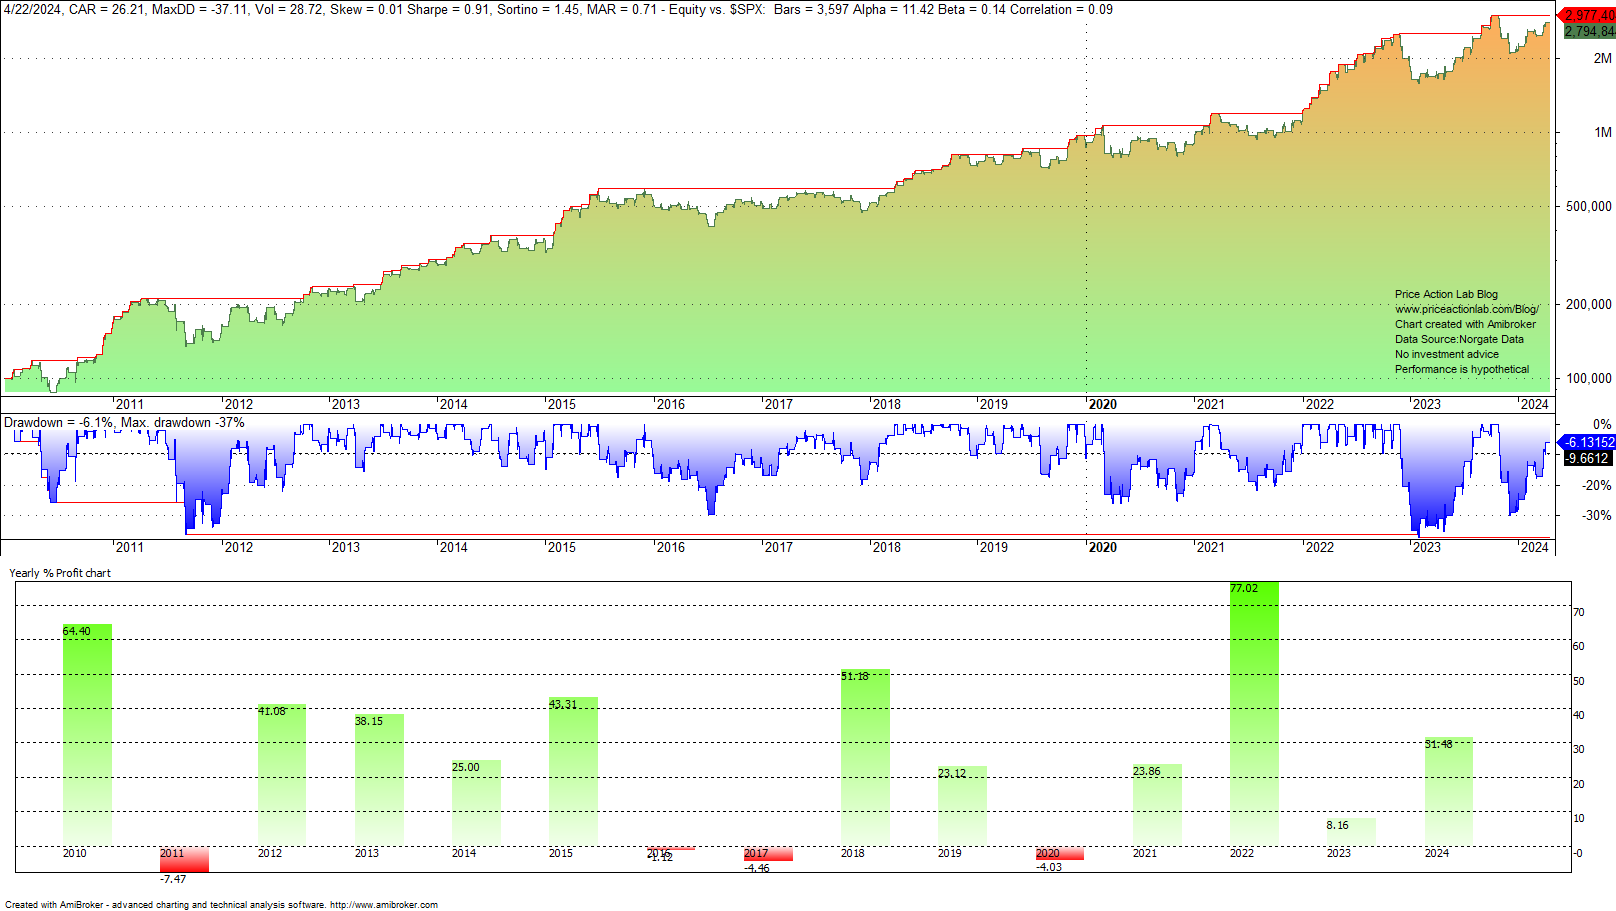
Backtest statistics
| Annualized return | 26.2% |
| Maximum drawdown | -37.1% |
| Volatility | 18.7% |
| Sharpe ratio | 0.91 |
| Beta | 0.1 |
| Skew of the equity curve | 0.01 |
| Win rate | 60.2% |
| Trades | 342 (171 long, 171 short) |
| Payoff ratio | 1.00 |
| Average holding period (days) | 4 for long, 6 for short |
| Exposure | 38.0% |
With an exposure of only 38% and an average holding period of five days, this strategy has had an annualized return of 26.2% since 2010. The Sharpe ratio is 0.91. The skew of the equity curve is nearly 0, and beta is also close to zero. These statistics make this strategy a potential diversifier. See “caveat emptor” below.
A Monte Carlo simulation based on equity curve changes revealed that the probability of a 50% drawdown or larger for the long-short strategy is 30% or lower.
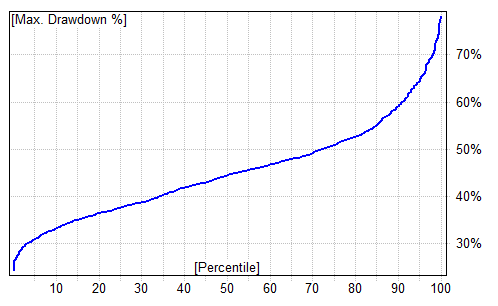
The probability of a 65% of larger drawdown is 5% or lower. This is a risky strategy, as further discussed below.
For a few days only, active Market Signals and All in One subscribers who have renewed at least once already, as well as new subscribers with a 6- or 12-month subscription, will have access to the strategy rules. We will terminate this offer on April 28, 2024. Contact us for details and activation of your subscription.
The strategy (ETFMO) rules are available to strategy bundle subscribers. Contact us for details and offers.
Strategy, ETFs, and rules
|
This post is for paid subscribers
Already a subscriber? Sign in |
Click here for a list of strategies.
About the risks of seasonality strategies
Seasonality strategies are risky because price action anomalies may disappear at any time. These strategies are only good for experienced traders who know how to manage risk and are willing to take on big risks.
When using a profitable seasonality strategy, inexperienced traders may lose money because they are afraid to act on signals that are risky at first but pay off in the long run.
Warning: The use of leveraged ETFs can result in a total loss and losses exceeding the available capital.
Disclaimer: No part of the analysis in this blog constitutes a trade recommendation. The past performance of any trading system or methodology is not necessarily indicative of future results. Read the full disclaimer here.
Charting and backtesting program: Amibroker. Data provider: Norgate Data
If you found this article interesting, you may follow this blog via RSS, Email, or Twitter


