


In hindsight, as the data reveal, the management of ARKK ETF did not use volatility targeting but instead was satisfied with a remarkable outperformance in 2022. Due to recency bias, investors always focus on recent underperformance and forget past outperformance.
I believe the concept behind the ARKK ETF was sound and still is, but the management was inadequate. They should have consulted CTAs on how to manage positions in volatile markets. CTAs know how investors behave, and for this reason, some target volatility. It is not always desirable, but if you want to stay in business, you have to take into account mass psychology and the “madness of crowds.”
It appears that the management of ARKK ETF was satisfied with a return of 153% in 2020 and did not reduce positions with trailing or any other position management method. Done ex ante, that would have significantly lowered the return for 2020, but also reduced the coming drawdown.
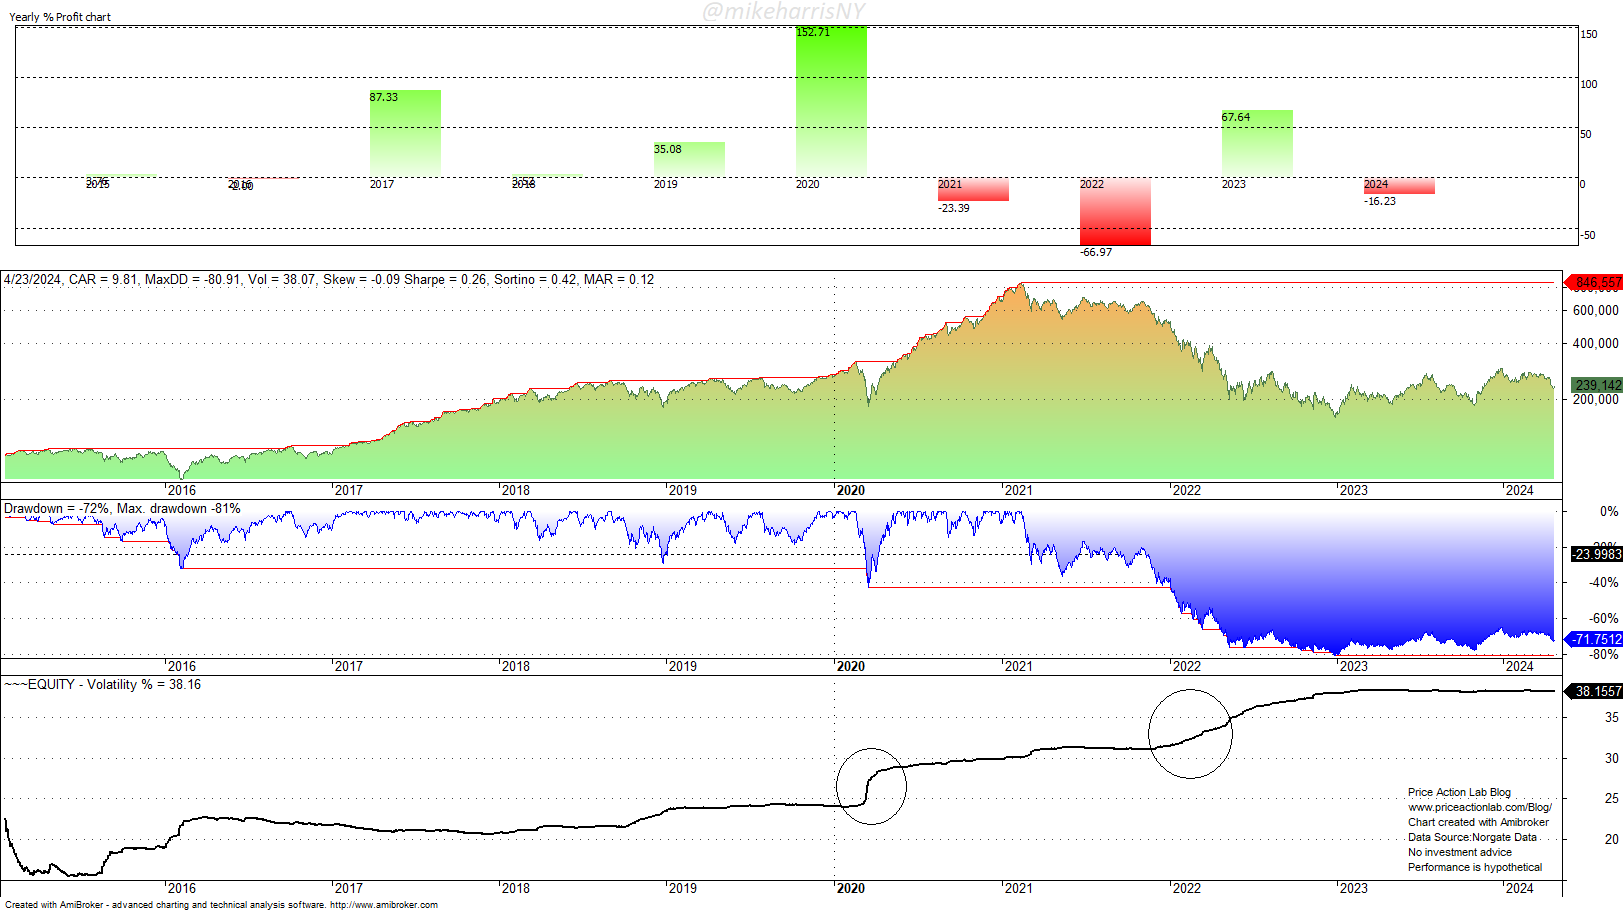
Buy and Hold Performance of ARKK ETF. Backtest. Price Action Lab Blog. Norgate Data.
The buy-and-hold equity performance chart shows how outperformance can turn into weakness. The ETF returned nearly 153% in 2020, and normally a reversion to some mean was reasonable. I do not know if it was greed or miscalculation that prevented applying volatility targeting, but the reversion occurred. It can be seen from the bottom pane of the above chart that equity volatility started rising in 2020, and by the end of 2022, it had increased from about 25% to nearly 33%. The increased volatility triggered an allocation reduction by portfolio managers, and that also contributed to a significant drawdown that reached as high as 81% by the end of 2022; that was basically the end of the promises and the start of damage control.
However, the basic premise did not fail. The ARKK ETF is now (again) tracking more closely the Nasdaq Next Generation 100 total return index ($NGXTR).
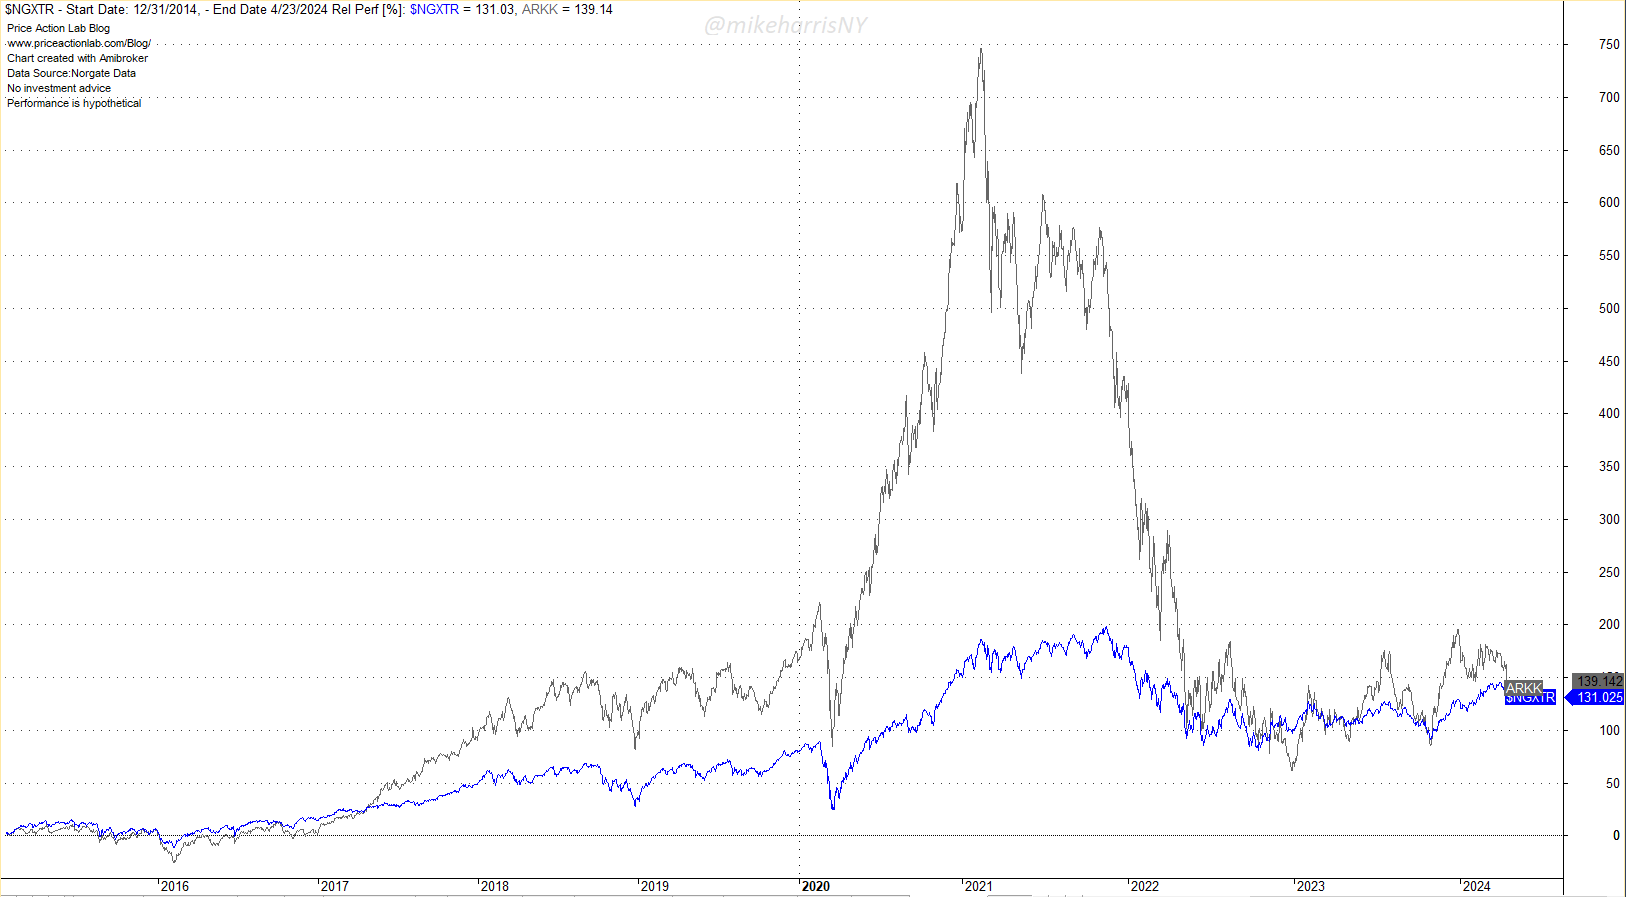
In fact, the correlation between the ARKK ETF and the Nasdaq Next Generation 100 total return index was always high; just the volatility was different. The average 0-lag, 24-month correlation has been +0.83, with a maximum of +0.94 and a minimum of +0.58.
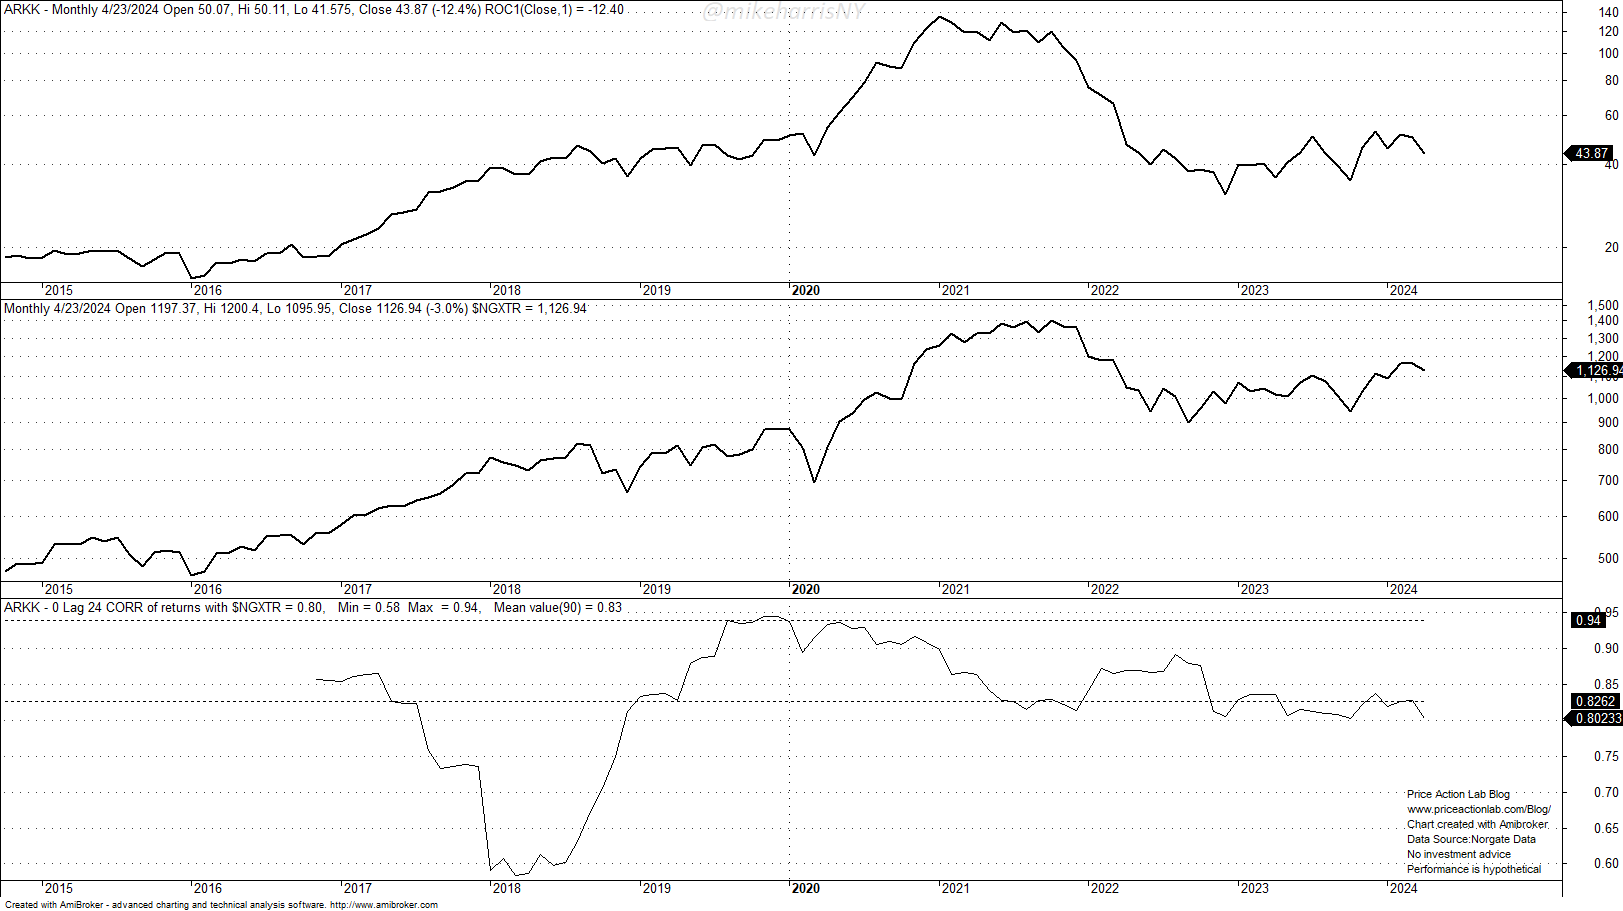
Note how the correlation reached its maximum near the start of 2020. The tracking of the index was close, but the volatility of returns was much different. Over the period considered, the volatility of the index has been 21.4%, versus 38.1% for the ARKK ETF, or nearly double. This was enough to create problems.
Apparently, and in hindsight, the problem with ARKK ETF was its significant outperformance. It may sound paradoxical, but outperformance can turn into weakness in these markets. This is one reason some active managers target volatility and risk-adjusted returns instead of total returns. Simply stated, those who entered near the top make a lot of noise after a large loss, although in reality it was their own miscalculation. When you invest in a fund after a 153% annual return, if you have a basic education in statistics, you should assign a high probability to a large drawdown. The fact that those greedy investors act as a herd and enter and exit the market at the same time only makes the issue worse.
I am not here to judge anyone, because outsiders always miss important pieces of the puzzle, but it is clear to me that ARKK ETF, although still a valid concept, did not exercise relevant risk and money management methods, including but not limited to using trailing stops, dynamic stops, and volatility targeting. Small private funds can always avoid these more sophisticated risk management methods and target absolute returns, but a publicly traded ETF with a large following on social media must be more sophisticated with its risk management, even when that would imply lower returns. Few remember the 153% return of ARKK in 2022, and nearly everyone focuses on the current 71% drawdown from all-time closing highs. In my opinion, it would be better to close this ETF and start a new one with better risk management rules because this one will be haunted forever, not because it was a bad idea but because of its outperformance in 2020.
It is paradoxical, but there cannot be markets without paradoxes.
Premium Content
You have immediate access to hundreds of articles when you subscribe. Premium Articles subscribers have immediate access to more than two hundred articles, while All in One subscribers have access to all premium articles, books, premium insights, and market signal content.
Specific disclaimer: This report includes charts that may reference price levels determined by technical and/or quantitative analysis. If market conditions change the price levels or any analysis based on them, we will not update any charts. All charts in this report are for informational purposes only. See the disclaimer for more information.
Disclaimer: No part of the analysis in this blog constitutes a trade recommendation. The past performance of any trading system or methodology is not necessarily indicative of future results. Read the full disclaimer here.
Charting and backtesting program: Amibroker. Data provider: Norgate Data
If you found this article interesting, you may follow this blog via RSS, Email, or Twitter.


