


The weekly market reports include a stock market forecast and a capital market analysis. To access the full report, you must subscribe to Premium Articles, Weekly Premium Articles, or All-in-One subscription.
Included in this weekly market report:
- A new dynamic.
- Growth vs. inflation.
- 109+1 days of reflexivity.
- A rare pattern in capital markets.
- The crowded pair trade.
Weekly Summary (April 8–April 12, 2024)
- Large-cap stocks fell due to rising geopolitical tensions.
- Following a hotter-than-expected CPI, bond prices fell and yields rose.
- Precious metals sold off on Friday after significant gains.
- The US dollar rallied amid rising geopolitical turmoil.
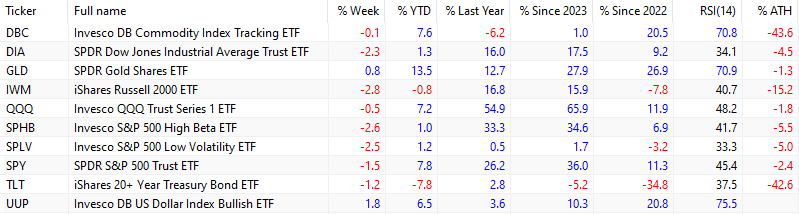
Despite a rally in precious metals, due to energy and grain losses, the DBC ETF fell 0.1%. Gold (GLD) rallied 2.4% to new all-time highs but ended the week up only 0.8% due to heavy selling on Friday. For the week, the U.S. dollar index (UUP) surged 1.8%. Gold (GLD) has outperformed the SPY ETF since 2022, with a return of 26.9% versus 11.3%, respectively. Gold, commodities, and the US dollar are overbought.
Large-cap stocks (SPY) fell 1.5% due to hotter-than-expected inflation and rising geopolitical tension. Tech stocks (QQQ) fell 0.5%. Small caps (IWM) lost 2.8% and are down 15.2% from their all-time highs.
High beta large caps (SPHB) fell 2.6% due to fears the Fed may push back against planned interest rate cuts and after a hotter-than-expected CPI. Due to a broad market selloff, the low-volatility large caps (SPLV) dropped 2.5%. The Dow Jones Industrial Average (DIA) ended the week down 2.3%.
The magnificent 7 equal-weight index rose 1.2% for the week, providing solid support to the broader market and averting a larger correction. AAPL gained 4.1%, while GOOG and TSLA gained 3.4% and 3.7%, respectively.
The TLT ETF fell 1.2% for the week. Since January 3, 2022, the TLT ETF has been down 34.8%, while large-caps (SPY) have gained 11.3%.
All market sectors fell, with financials (XLF) down the most by 3.6%. The technology sector (XLK) fell the least, by 0.5%. Year-to-date, the energy sector (XLE) is up the most, by 15.6%.
All in all, the stock market sold broadly this week, but gains in a few large-cap stocks prevented an accelerated decline.
A new dynamic
Following the significant fiscal stimulus during the 2020 pandemic, a new inflation dynamic has emerged. The new dynamic has resulted in a 12% divergence above the previous trend that started after the Great Financial Crisis (GFC), as indicated on the chart.
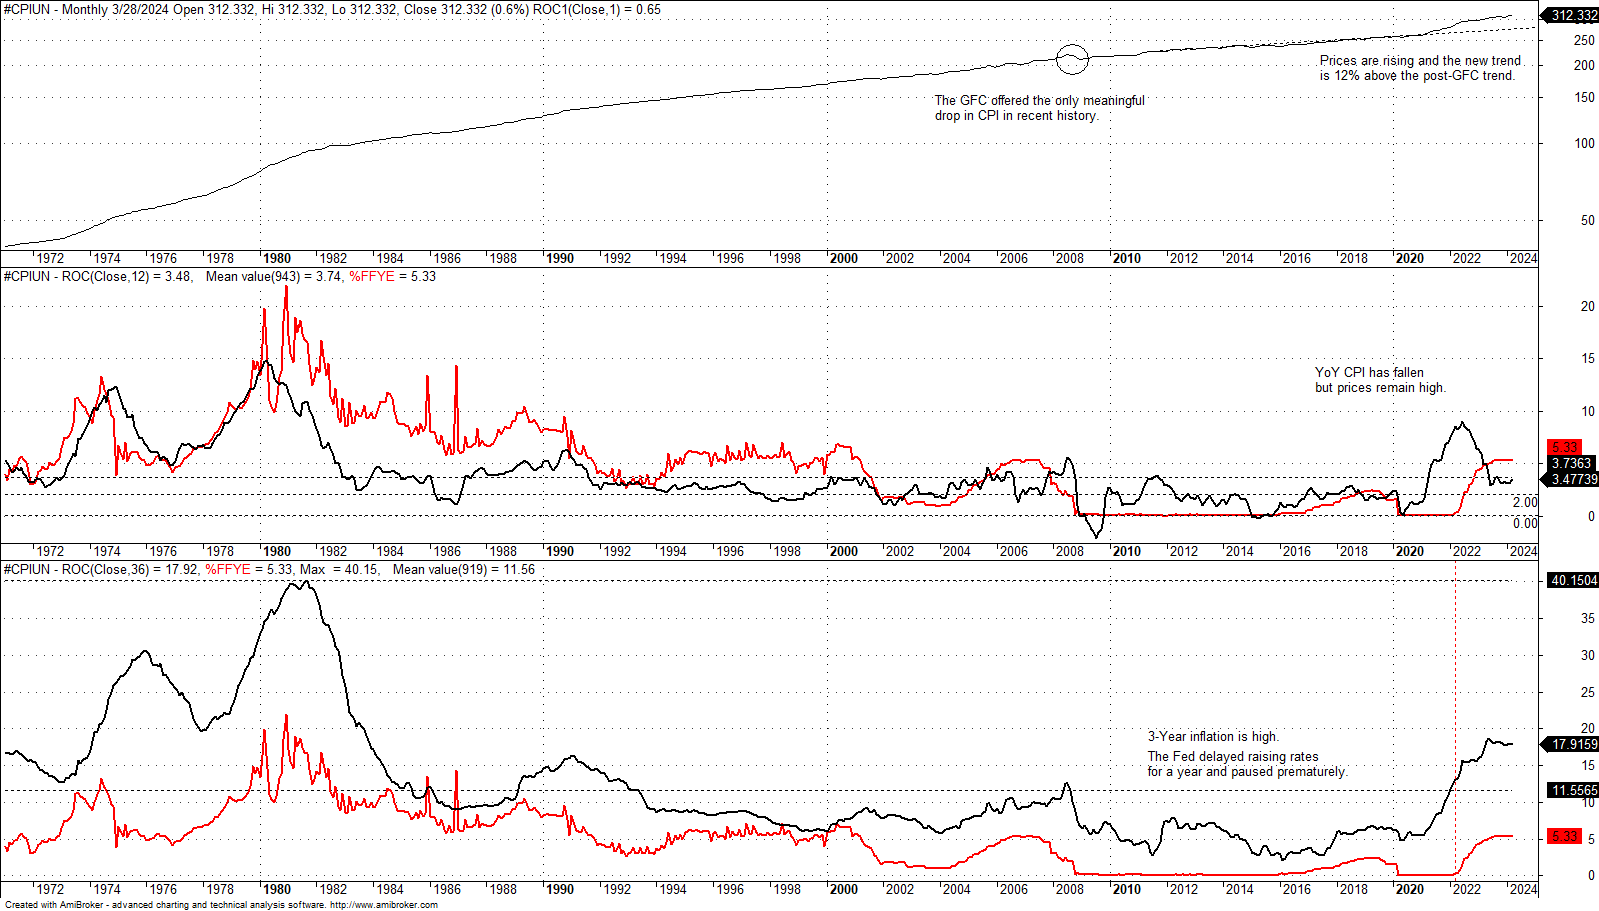
A return to the old inflation dynamics cannot occur without significant deflation. As noted on the chart, the GFC offered the only meaningful drop in CPI in recent years, which was about 4.5%. Quantitative easing averted a deep deflation, but at the cost of accumulating excesses, which, along with the pandemic stimulus, led to the current new inflation dynamic. More importantly, this new inflation dynamic has facilitated “inflationary growth,” an unsustainable process relying on excesses and financial engineering. After the market forecast, see below for more details and a chart.
Stock market forecast
The forecasting model generates well-defined entry and exit signals for the SPY ETF. The model does not forecast exact tops and bottoms, but the objective is to minimize losses due to large corrections and maximize gains in uptrends. For the last 32 years, the accuracy has been close to 100%. We describe the current signal, duration, and strength below.
|
This post is for paid subscribers
Already a subscriber? Sign in |
Premium Content
20% perpetual discount with code PA20
Premium articles, Market signals, and All-in-One subscriptions
This offer will expire on April 14, 2024, at midnight.
By subscribing, you have immediate access to hundreds of articles. Premium Articles subscribers have immediate access to more than two hundred articles, and All in One subscribers have access to all premium articles, books, premium insights, and market signal content.
Specific disclaimer: This report includes charts that may reference price levels. If market conditions change the price levels or any analysis based on them, we may not update the charts. All charts in this report are for informational purposes only. See the disclaimer for more information.
Disclaimer: No part of the analysis in this blog constitutes a trade recommendation. The past performance of any trading system or methodology is not necessarily indicative of future results. Read the full disclaimer here.
Charting and backtesting program: Amibroker. Data provider: Norgate Data
If you found this article interesting, you may follow this blog via RSS, email, or Twitter.


