


The weekly market reports include a stock market forecast and a capital market analysis. To access the full report, you must subscribe to Premium Articles, Weekly Premium Articles, or All-in-One subscription.
Included in this weekly market report:
- The illusion of alpha.
- 105 days of reflexivity.
- Has the stock market topped out?
- Crowded pair trade.
Weekly Summary (April 1–April 5, 2024)
- Large-cap stocks fell due to fears of rising inflation.
- Following strong economic data, bond prices fell and yields rose.
- Precious metals and energy led the rally in commodities.
- The US dollar fell slightly as gold surged to new all-time highs.
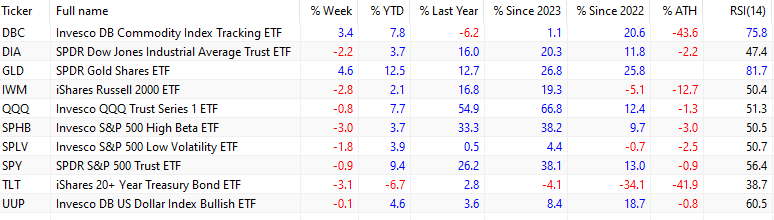
The spot price of crude oil jumped 4.4% this week to $87.7 per barrel. Year-to-date, spot crude oil is up 22%. The DBC ETF gained 3.4% thanks to a broad commodities rally and gains in energy and precious metals. Gold (GLD) rallied 4.6% to new all-time highs on the back of a slightly weaker U.S. dollar index (UUP), which fell 0.1% for the week. Gold (GLD) has outperformed the SPY ETF by a factor of two since 2022, with a return of 25.8% for the former versus 13% for the latter.
Large-cap stocks (SPY) fell 0.9% due to fears of rising inflation after the recent commodities rally. Tech stocks (QQQ) fell 0.8%. Small caps (IWM) lost 2.8% and are down 12.7% from their all-time highs.
High beta large caps (SPHB) fell 3% due to fears the Fed may push back against planned interest rate cuts. After broad market sales, the low-volatility large caps (SPLV) lost 1.8%. The Dow Jones Industrial Average (DIA) ended the week down 2.2%.
The magnificent 7 equal-weight index rose 0.5% for the week, providing a small cushion for the market against broad selling pressures. META surged 8.6%, and AMZN gained 2.6%.
The TLT ETF fell 3.1% for the week. Since January 3, 2022, the TLT ETF has been down 34.1%, while large-caps (SPY) have gained 13%.
All market sectors fell, except energy (XLE), which gained 3.9% due to a rally in crude oil, and communications services (XLC), which ended the week with a gain of 1.1%.
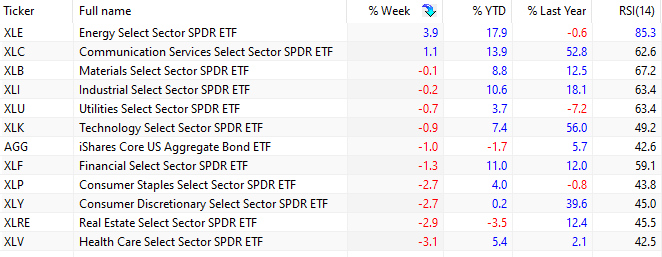
Health care (XLV) fell the most, 3.1%, with United Health (UNH) and Johnson & Johnson (JNJ), the top two holdings with a weight of 8.51% and 7.24%, dropping 8.8% and 3.7% for the week, respectively.
All in all, the stock market selling was broad, but gains in a few large-cap stocks prevented an accelerated decline. Has the stock market topped out? See the relevant section below for more information.
The illusion of alpha
Due to limited samples and the finite risk of ruin, trading or investing strategy alpha, whether measured as simple excess or risk-adjusted return, is an illusion.
The performance of a trend-following algorithm with 23 futures contracts is shown below.
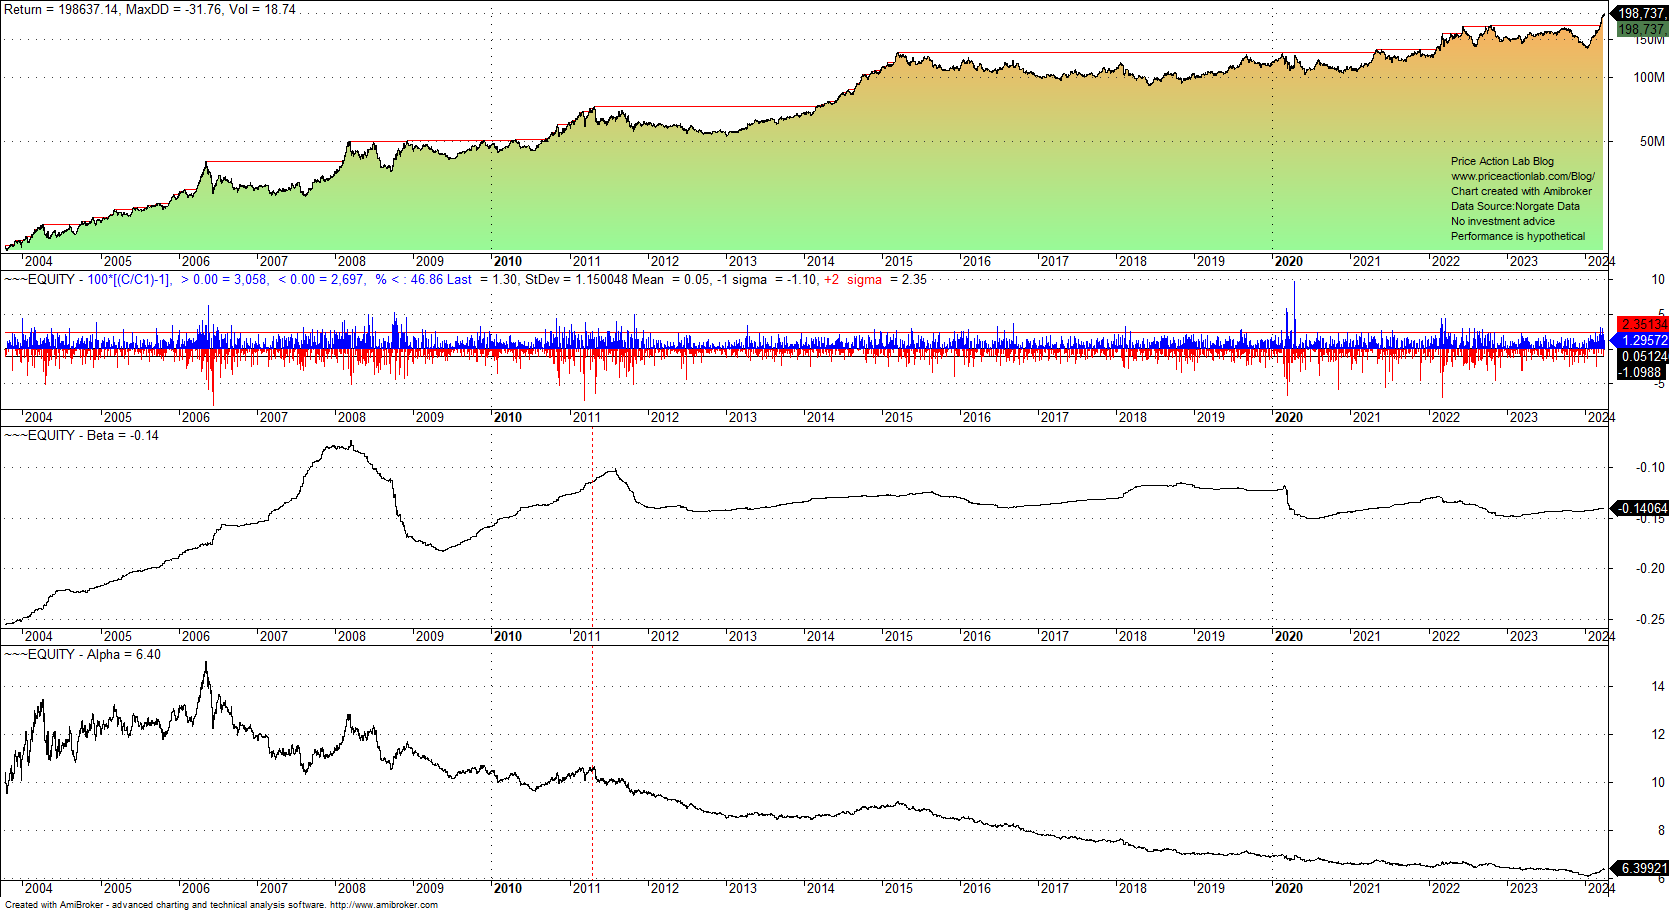
The top two charts show the equity and daily return histograms. The next chart shows that beta has remained in a tight range since 2010. However, the alpha has steadily decreased from around 10% to 6.4%. The benchmark is the S&P 500 index.
Trend-followers had high alpha expectations due to their good performance in the 1980s and 1990s, as well as during the dot-com and GFC bear markets. The “lost decade” from 2009 to 2018 resulted in a much lower realized alpha.
A lower realized alpha may be a best-case scenario, as in many cases, the alpha completely disappears or even turns negative. The ARKK ETF is an example.
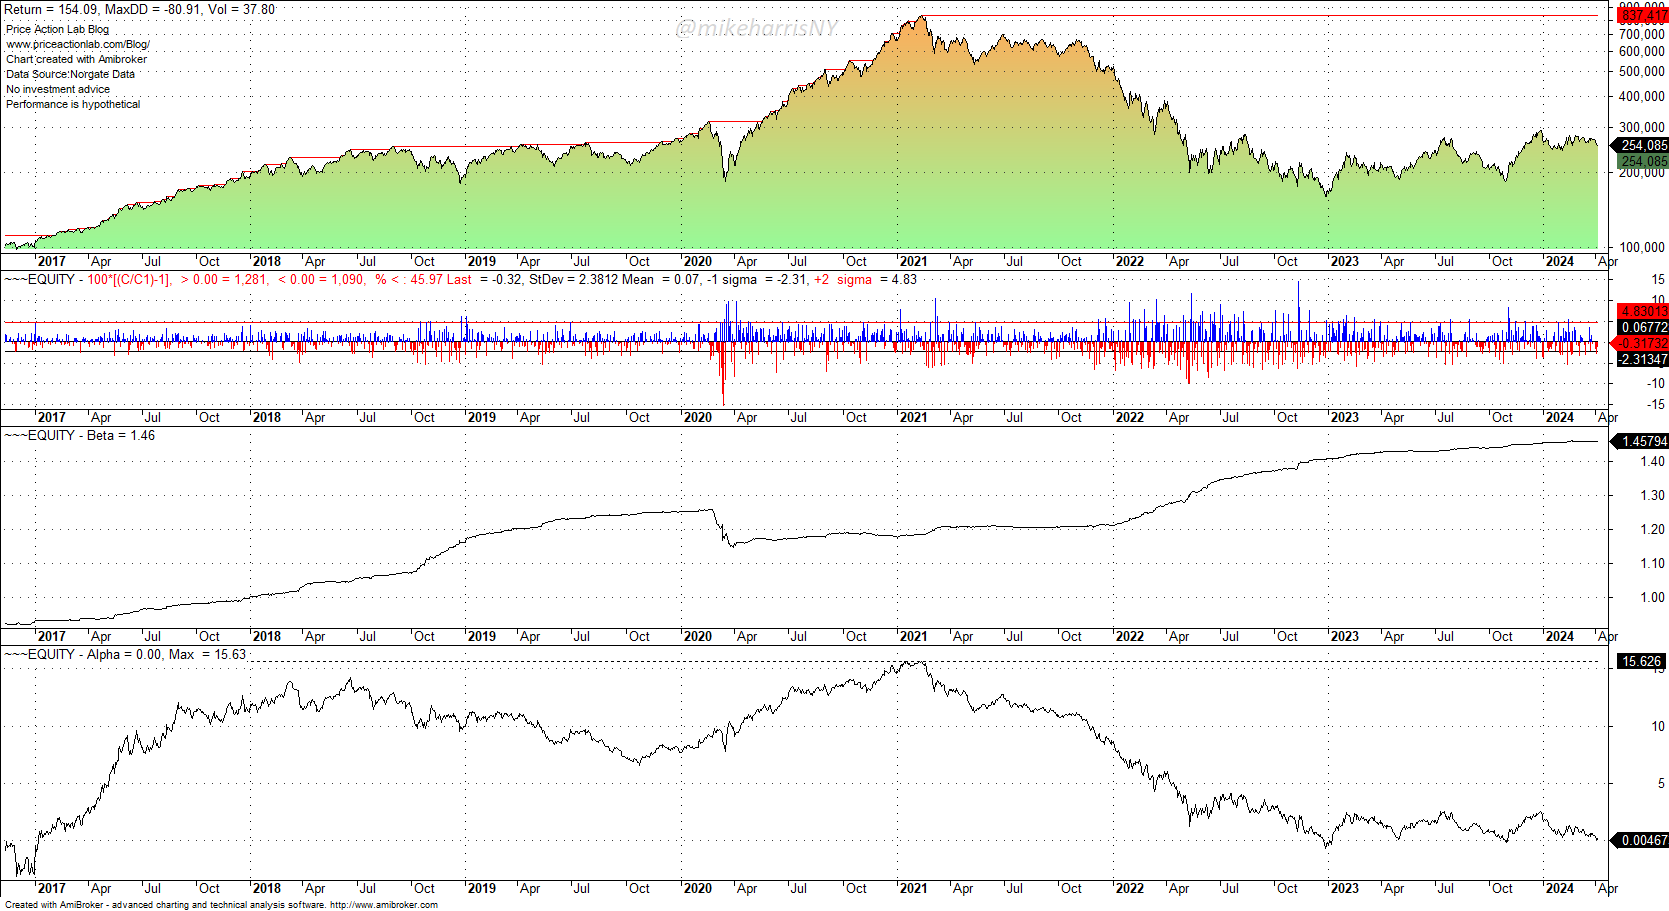
In early 2021, the alpha was about 15.6%, but then, due to a left-tail event in inflation and its impact on long-duration tech stocks, it fell to 0% by the end of 2022, or in a period of just two years. In this case, alpha was an illusion due to limited samples and a favorable market regime. This is not a problem specific to ARKK ETF; it can happen to any strategy. Alpha is an illusion. See this article for more details.
Stock market forecast
The forecasting model generates well-defined entry and exit signals for the SPY ETF. The model does not forecast exact tops and bottoms, but the objective is to minimize losses due to large corrections and maximize gains in uptrends. For the last 32 years, the accuracy has been close to 100%. The current signal, duration, and strength are described below.
|
This post is for paid subscribers
Already a subscriber? Sign in |
Premium Content
20% perpetual discount with code PA20
Premium articles, Market signals, and All-in-One subscriptions
This offer will expire on April 8, 2024, at midnight.
By subscribing, you have immediate access to hundreds of articles. Premium Articles subscribers have immediate access to more than two hundred articles, and All in One subscribers have access to all premium articles, books, premium insights, and market signal content.
Specific disclaimer: This report includes charts that may reference price levels. If market conditions change the price levels or any analysis based on them, we may not update the charts. All charts in this report are for informational purposes only. See the disclaimer for more information.
Disclaimer: No part of the analysis in this blog constitutes a trade recommendation. The past performance of any trading system or methodology is not necessarily indicative of future results. Read the full disclaimer here.
Charting and backtesting program: Amibroker. Data provider: Norgate Data
If you found this article interesting, you may follow this blog via RSS, email, or Twitter.


