

There is a huge divergence between theory and practice in quantitative finance. Finance professionals often use fancy terminology during podcasts and in articles, but in reality they employ simple and common sense methods because they work.
Optimal leverage, also known as Continuous Kelly, was developed by Ed Thorpe and has this seemingly simple formula:
f* = (Annualized return – Risk-free return)/Variance
The above formula basically yields the required leverage in a continuous domain for maximizing equity growth.
Although in the case of unlimited capital and no borrowing constraints, optimal leverage will maximize equity growth, in practice, these assumptions are unrealistic; every practitioner has capital and borrowing constraints.
There is also another issue, which is more fundamental. For any stochastic process other than weak sense stationary (i.e., a process for which the mean and variance remain constant throughout time), the optimal leverage f* will vary and may become excessive depending on the lookback period for calculating returns.
Below is an example of a lookback period of about four years in the daily timeframe and a risk-free interest rate set to 0% in the case of the S&P 500.
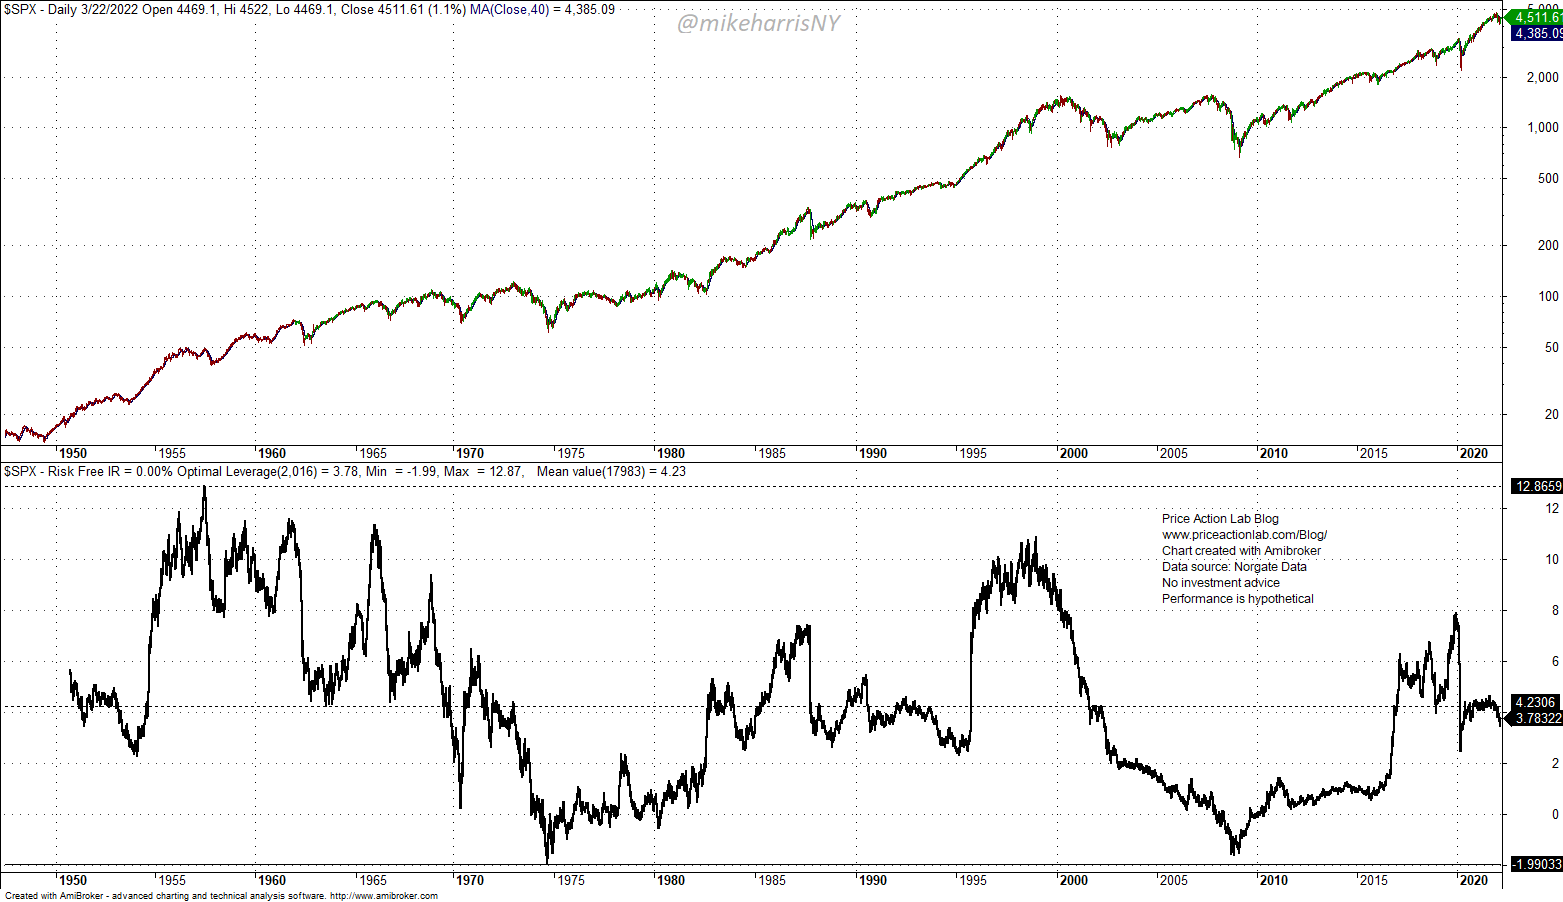
The optimal leverage is extremely volatile with a maximum of about 12.9% and a minimum of about -2% (leveraged short 2X).
This is noise, and nothing useful. If we anchor the calculation of the relevant parameters at the start of the series in 1942, we get the following for an average risk-free interest rate of 4.25% for the optimal leverage starting in 1950.
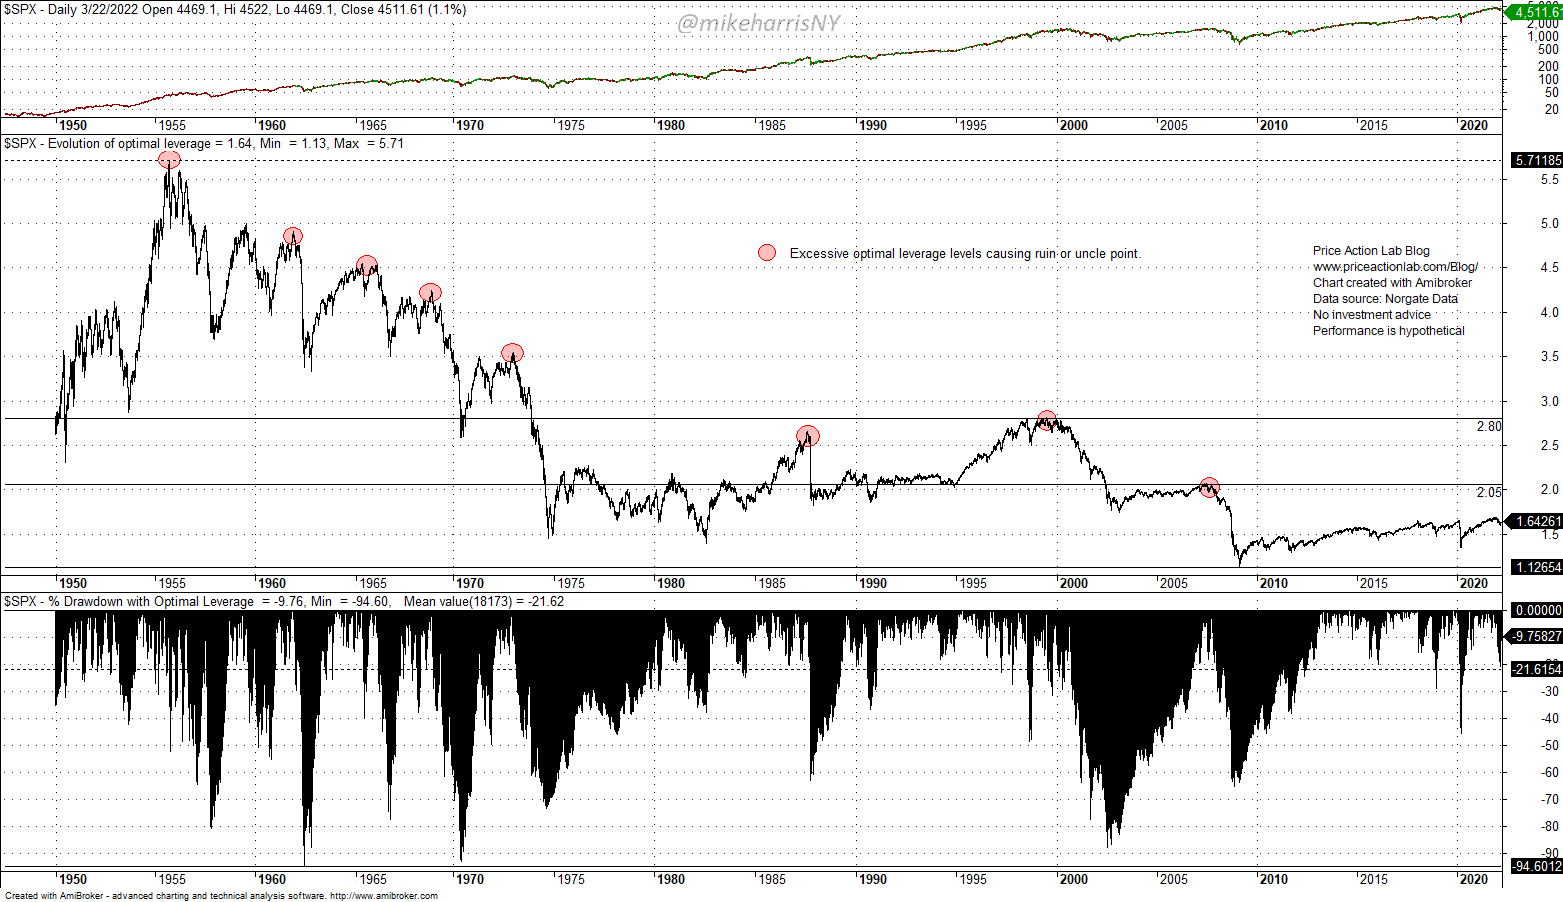
The results look more “realistic,” but optimal leverage levels at the tops before bear markets and large corrections are still unrealistically high. These are marked on the chart, and the last graph is the drawdown profile of buying and holding the S&P 500 with optimal continuous leverage for illustration purposes only, because in practice, this is impossible due to high transaction costs.
The drawdown profile indicates several instances of nearly ruin or uncle point with the drawdown rising above 60% and even above 80% and close to 95%.
Some quants recommend using half Kelly, but optimality is lost and one may use anything they determine minimizes the risk of ruin.
The concept of optimal leverage is another quantitative finance mirage, like that of an optimal portfolio. Market returns are fat-tailed; the correlations and covariances fluctuate widely. What may be optimal at time T1 may turn highly risky at time T2 and lead to uncle point beyond which there is no way to continue.
If you found this article interesting, you may follow this blog via RSS or Email, or in Twitter.
Premium Content 10% off for blog readers and Twitter followers with coupon NOW10
Disclaimer: No part of the analysis in this blog constitutes a trade recommendation. The past performance of any trading system or methodology is not necessarily indicative of future results. Read the full disclaimer here.


