This is a sample report. Signals and performance are outdated.
Signals for November 13, 2020
Signals are displayed only to subscribers.
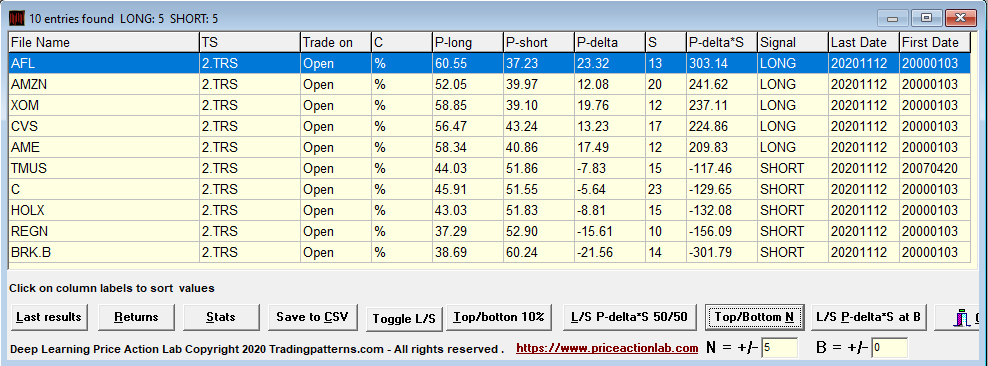
S&P 500 signals – Top 5/Bottom 5
Signal information
Signal entry: open of the day. Signal exit: close of entry day.
Stock selection is made according to rank = P-delta × S.
P-delta is the directional bias P-long – P-short. S is the significance of the result.
Signal is LONG or SHORT. Last Date is the calculation date.
First Date is the first date in the historical data file for each stock.
Trade on is the signal entry. C and TS are used internally for the calculations.
For signal history click here. (Subscription start date: June 17, 2020)
Returns are calculated based on equal dollar allocation.
Weekly performance November 9 – November 13, 2000
| Date | Long/Short* | S&P 500 |
| November 9 | +0.5% | +1.2% |
| November 10 | +0.6% | -0.1% |
| November 11 | +0.1% | +0.8% |
| November 12 | +0.0% | -1.0% |
| November 13 | +0.5% | +1.4% |
Note: Performance and equity curve chart are updated after the close of the last trading day of the week.
Performance summary (March 5, 2020 to November 13, 2020)
| Long/Short Strategy | S&P 500 | |
| Since March 5, 2020 | +27.0%* | +14.3% |
| Drawdown from peak | -0.8% | 0% |
| Max. drawdown | -5.8% | -28.6% |
| Sharpe | 2.51 | 0.68 |
| Mean return | +0.138% | +0.11% |
| Standard deviation | 0.887% | 2.454% |
| Minimum return | -2.7% | -12.0% |
| Maximum return | +6.2% | +9.4% |
Below is the equity curve for S&P 500 long/short signals (subscription link) based on backtests. The equity line (black) represents the growth of the average daily change of all signals from open to close of the day. Buy and hold performance is also shown (red) along with the correlation of the daily returns. Note: the equity curve chart is usually updated after the close of the last trading day of the week.
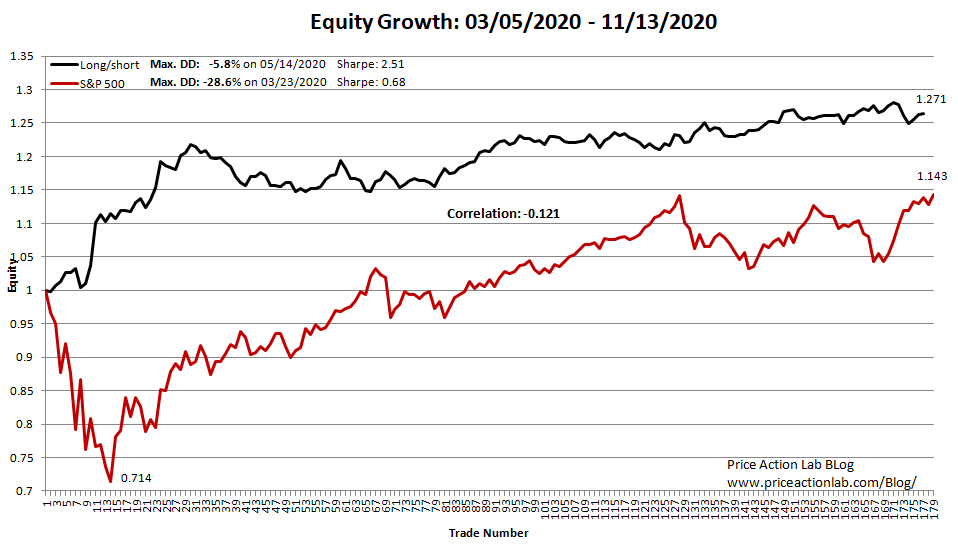
Correlation of strategy and S&P 500 daily returns is -0.121.
* Performance is based on backtests. Actual performance may vary in any direction due to high volatility periods, slippage, commissions and other known or unknown factors that may affect trading performance.
About the long/short signals and strategy switching
Signals are generated by DLPAL LS software. For generating just the signals, the retail reduced functionality version is sufficient. For more advance analysis including historical data generation for backtests, the professional version is required.
During higher volatility periods we use a long/short strategy that avoids overnight risk by entering positions at the open and exiting at the close of the day. With this strategy, we minimize overnight risk although trying to profit from from open to close is challenging. Daily open to close signals are more transaction intensive than holding positions overnight. On the other hand, these signals in addition to avoiding overnight risk, they also allow more discretion and flexibility, in case that is desired.
The open to close strategy has worked well since during the market correction in March 2020 but if volatility drops significantly, then regular trading hour profit potential may decline. In case that happens we may switch to smooth features and/or the regular Rank strategy that holds positions overnight. The Rank strategy is based on the same principles as the one used for weekly Market Signals reports with Dow 30 stocks but in this case all entry and exit signals apply to open of a day and the signal mix is rebalanced daily.
We also have other choices of strategies to use depending on market regimes. One strategy for example keeps positions for a minimum number of days. This is desirable in case volatility is very low. In addition, we may use different types of features depending on market regime and market risks.
Disclaimer: The Long/Short Signals are provided for informational purposes only and do not constitute investment advice. We do not warrant the accuracy, completeness, fitness or timeliness for any particular purposes of the Long/Short Signals. Under no circumstances the Long/Short signals should be treated as financial advice. The author of this website is not a registered financial adviser. Before subscribing read our full Disclaimer and Terms and Conditions. Acceptance of terms and conditions is required before subscribing. More information is provided on subscription page.