


Short-term portfolio trading strategies can generate absolute returns during times that longer-term strategies experience a drawdown. In this article we include an example of how to use DLPAL to develop of strategy for trading Dow stocks.
Common features
DLPAL offers several alternatives for developing portfolio trading strategies, some discussed in other articles. In this article we develop strategy for trading a portfolio of Dow stocks by identifying common features in their price series.
In DLPAL, a common feature is a basic strategy that satisfies performance and risk/reward objective when tested in historical data of a security but in addition it is profitable in the other securities in the portfolio based on a minimum profit factor. In the example of this article we require that all common features found in each security are profitable in at least 50% of the other securities in the portfolio with a profit factor greater than 1.2. For example, if DLPAL identifies in the in-sample a feature that when used as a strategy it is profitable in AAPL according to the criteria defined on the search workspace, the same feature must be also profitable in at least 15 other stocks and in each case the profit factor must be greater than 1.2
For the strategy identification we use 9 years of in-sample and 9-years of out-of-sample because we want to study the robustness of the machine learning process.
Time-frame: Daily (adjusted data)
Universe: Dow 30 stocks (current composition)
In-sample period: 01/03/2000 – 12/31/2008
Out-of-sample period: 01/02/2009 – 04/12/2017
Trade entry: Open of next bar
Below is the DLPAL search workspace for this study.
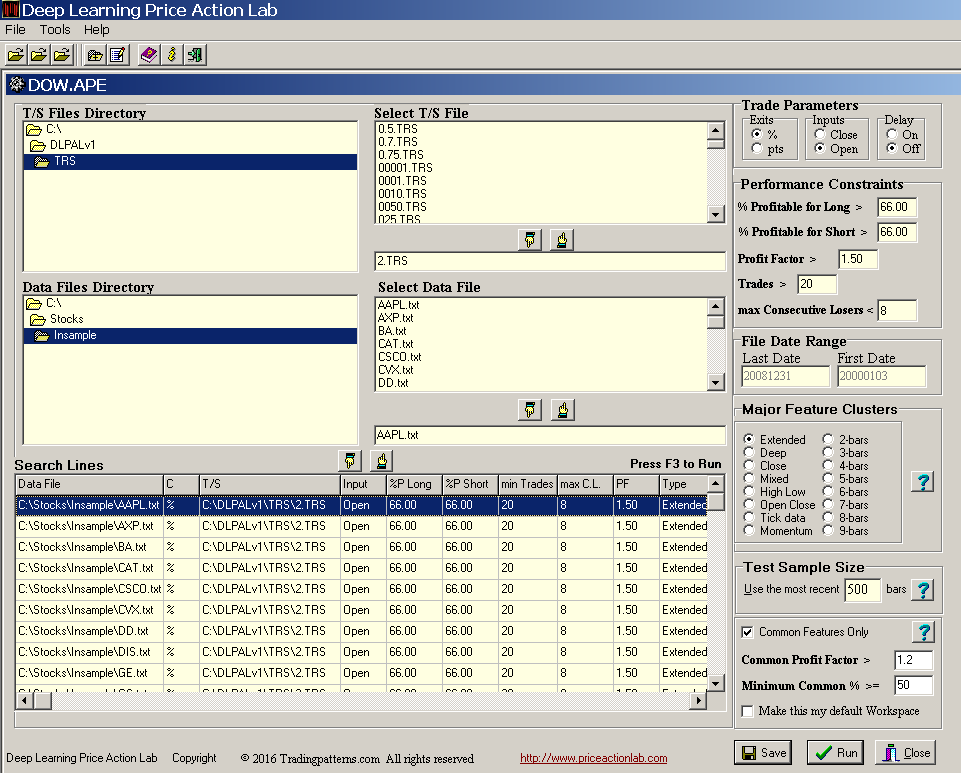
There are 30 search lines in the workspace, one for each Dow stock. The option “Common Features Only” is checked to have the program search for common features. The “Common Profit Factor >” is set at 1.2 and the “Minimum Common % >=” is set at 5.
This search took about 36 hours running in the background. Below are the results:
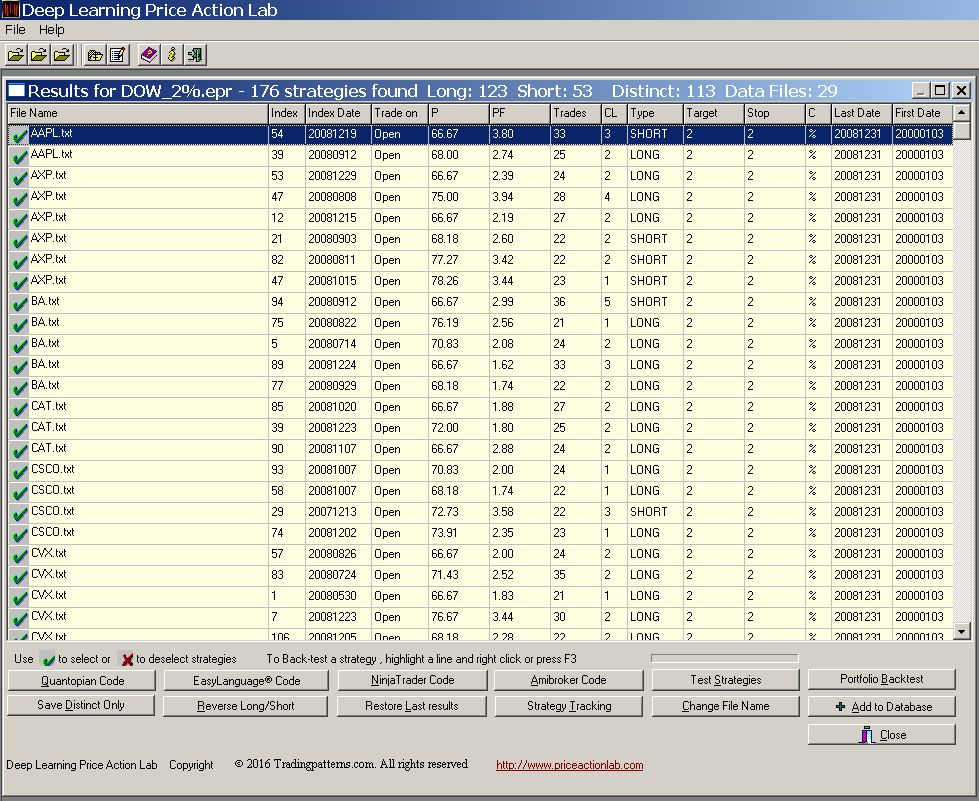
DLPAL machine learning found 176 strategies (features), 123 long and 53 short. But note that only 113 are distinct because some have the same structure due to multiple securities defined on the workspace.
Generating code for Amibroker
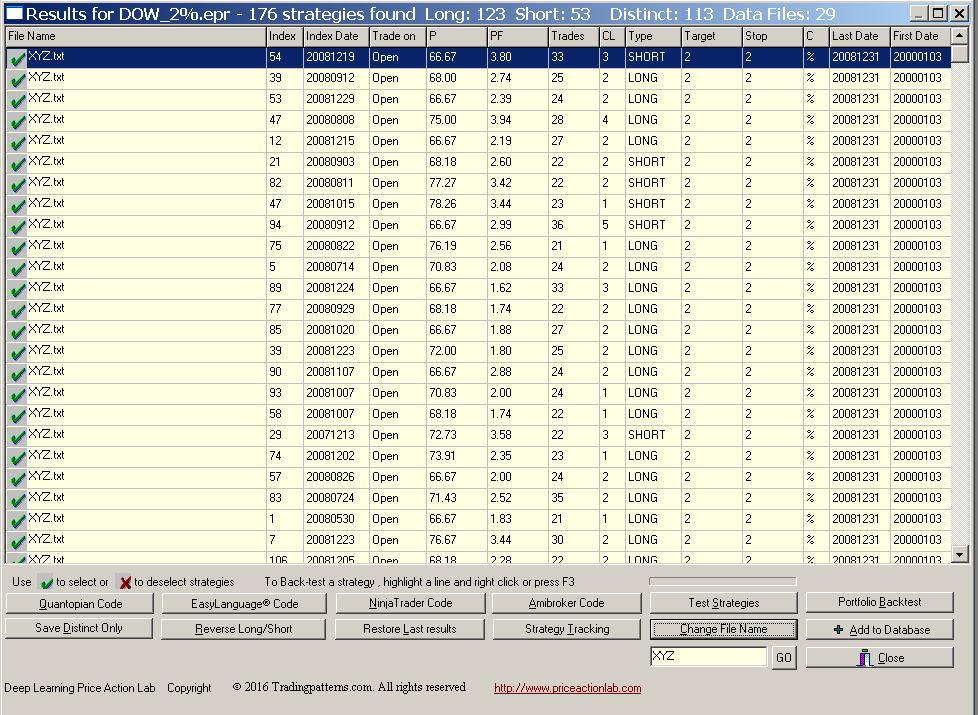
DLPAL generates system code for features of single symbols with same parameters, but in this case we can get around this since the parameters, such a target and stop, are the same. We first have the program replace all symbols with a common symbol using the “Change File Name” tool at the bottom of results. We can use something like XYZ, as shown below.
Now there is only one symbol but there are still redundant features. We can eliminate the redundant ones by using the “Save Distinct Only” tool at the bottom of the results. The new results can be saved and then opened to generate the code, as shown below.
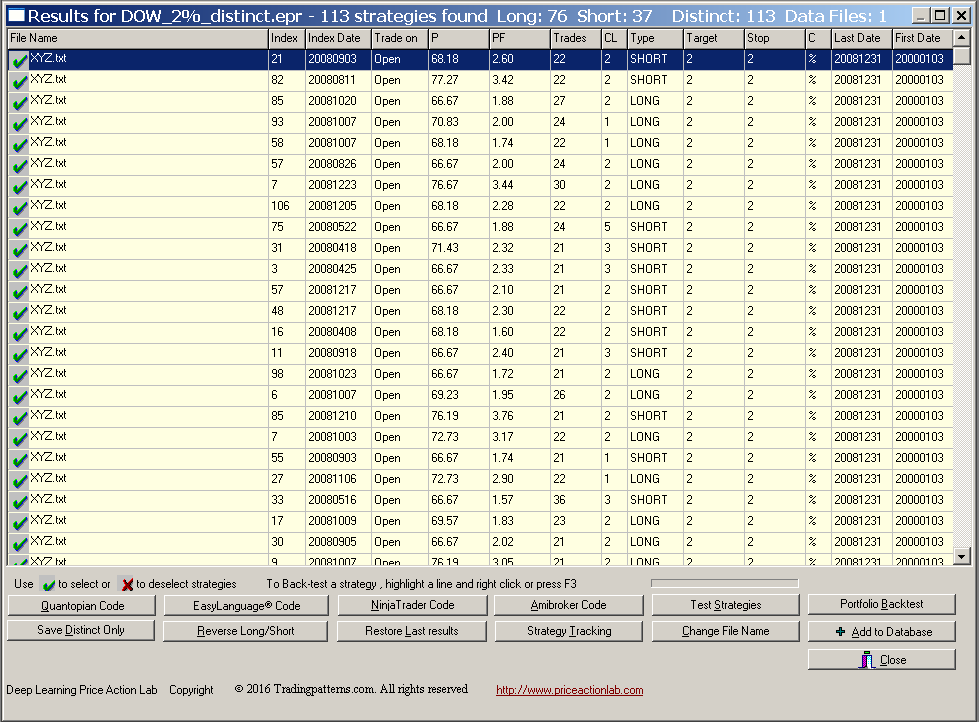
It may be seen from the above results that only the 113 distinct features were saved.
Then, we can click Amibroker Code and then System Code to have a system generated with separate conditions for long and short signals.
Portfolio strategy backtesting
There are several possible ways of using the system code for the XYZ symbol to trade a portfolio of 30 Dow stocks. We elect to develop a long-only strategy based on the long entry conditions and use the short-entry conditions to exit the signals generated for the various stocks. Therefore, we will not use the 2% exits in this case.
Time-frame: Daily (adjusted data)
Strategy type: Dow portfolio, long-only
Universe: Dow 30 stocks (current composition)
Maximum open positions: 30
Commission per share: $0.01
Position size per stock: Available equity/30
Trade entry: Open of next bar (no look-ahead bias)
Below are the equity and monthly returns results of the backtest for in-sample and out-of-sample. Click on images to enlarge.
 |  |
There are no losing years in the out-of-sample. Below are Monte Carlo simulation results. Click on images to enlarge.
 |  |
The probability of a maximum drawdown of more than 10% is less that 5%.
Below are a few performance parameters for the strategy in the out-of-sample only.
| Parameter | Out-of-sample value |
| CAR | 8.43% |
| Sharpe | 0.85 |
| Max. DD | -15.6% |
| MAR | 0.54 |
| Trades | 6675 |
| Win% | 61.6% |
| Exposure | 48% |
| Profit Factor | 1.37 |
| Avg. bars in trades | 5.3 |
Therefore, we have demonstrated the basic concept. Still, there is some work to be done to create a final system but this depends on specific objectives. The objective here was to demonstrate the basic steps involved.
Disclaimer: No part of the analysis in this blog constitutes a trade recommendation. The past performance of any trading system or methodology is not necessarily indicative of future results. Read the full disclaimer here.
If you have any questions or comments, happy to connect on Twitter: @priceactionlab
You can download a demo of DLPAL from this link. For more articles about DLPAL and DLPAL PRO click here.


